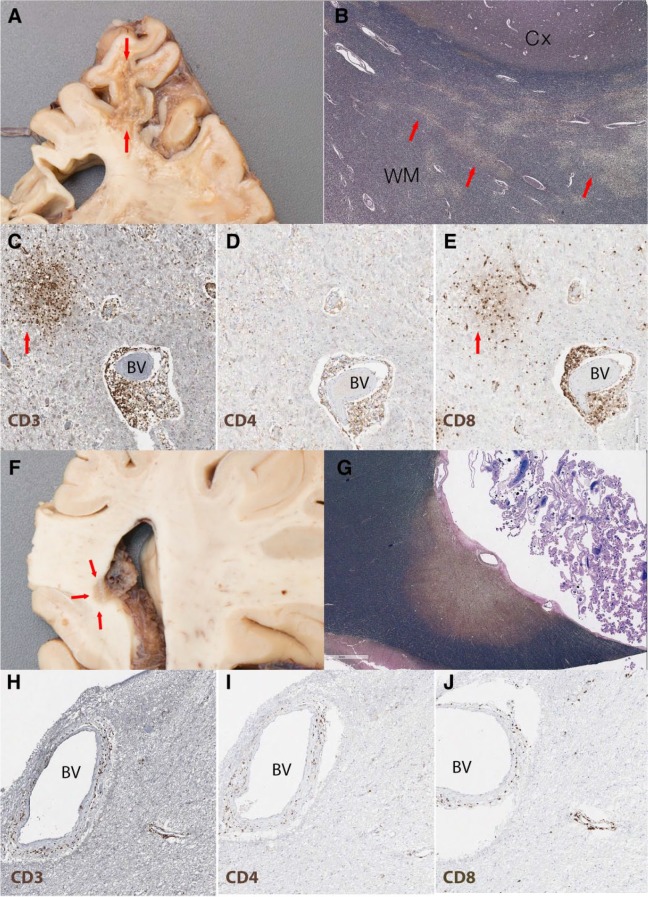
Figure 2.
Gross and microscopic images of the PML chronic IRIS demyelinating lesions. (A-E) Chronic cavitary demyelinating plaque with high JC viral load (210 743 copies/10 mL DNA); (A) Cross section and high-power view of frontoparietal lesion with shrunken pitted white matter (arrows); (B) LFB/NF staining shows “salt on ice” pattern of demyelination (highlighted by arrows) in deep white matter (WM) and grey-white matter (Cx) junction; (C) CD3 staining (brown) highlights numerous T-cells around blood vessels (BV) but also in aggregates in the nearby parenchyma (arrow); (D) CD4 staining (brown) shows a subpopulation of T-cells; (E) CD8 staining (brown) demonstrates the CD8 predominance in both the perivascular and parenchymal (arrow) infiltrate. (F-J) Periventricular lesion in the splenium of the corpus callosum with low JC viral load (587 copies/10 mL DNA); (F) Coronal section trough the splenium of corpus callosum shows a well-demarcated periventricular demyelinating plaque (arrows); (G) LFB/NF staining shows a single well-demarcated chronic demyelinating periventricular plaque; the amount of inflammation is significantly less than the frontoparietal lesion in “C” with occasional perivascular T-cells. H, CD3; I, CD4; J, CD8. LFB/NF, Luxol fast blue (stains myelin blue)/neurofilament (stains axon black); CD3, T-cells, CD4 and CD8 subpopulation of T-cells.

