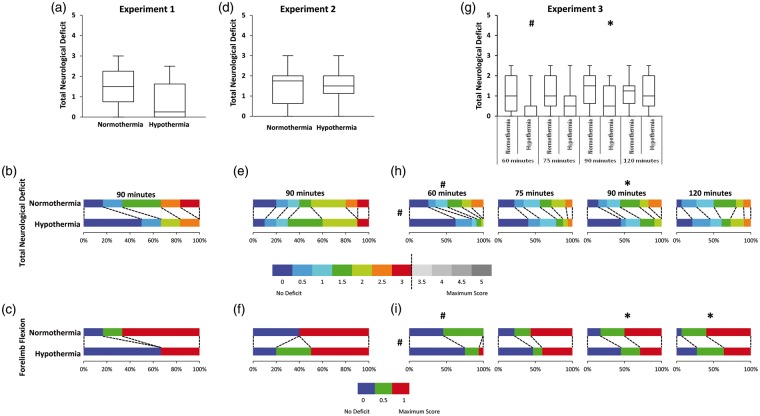
Figure 2.
Behavioural deficit assessed using a five-point neuroscore at 24 h after stroke. Box plots of total score at 24 h (a, d, g – Experiments 1, 2, 3). Proportion of animals with each score broken into 0.5 unit increments (b, e, h – Experiments 1, 2, 3). No animal scored greater than 3. Proportion of animals with deficits in forelimb flexion (c, f, i – Experiments 1, 2, 3). #p < 0.001. *p < 0.05.

