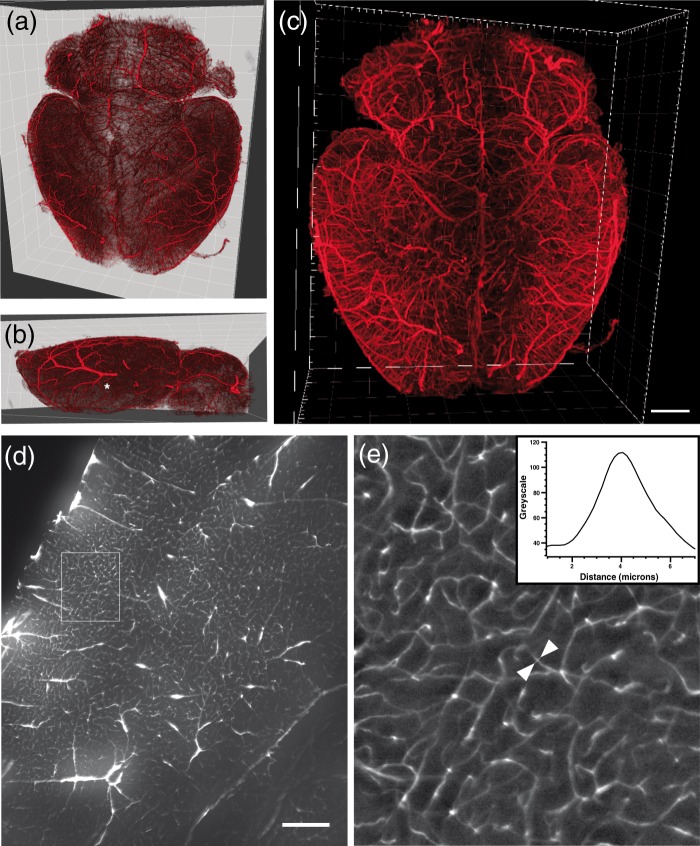
Figure 3.
Visualization of the vascular architecture of a healthy whole mouse brain. 3D volume rendering of brains are shown in blend mode (a, b), which accentuates the surface features (the middle cerebral artery in (b) is labeled with an asterisk (*)), or (c) in maximum projection intensity mode. Volume renderings were generated from image stacks acquired with 1.6 × magnification. (d) Transverse optical section of the striatum and adjacent cerebral cortex acquired at 6.4 × magnification. (e) Enlargement of insert in (d) exhibiting brain capillaries at higher magnification. The graph on the upper right displays a signal intensity profile across a typical capillary that was taken along a line connecting the two white arrows in the image. Note that capillaries with diameters of 5 µm are visualized with high contrast. Scale bar in (c), 1 mm; in (d), 300 µm.

