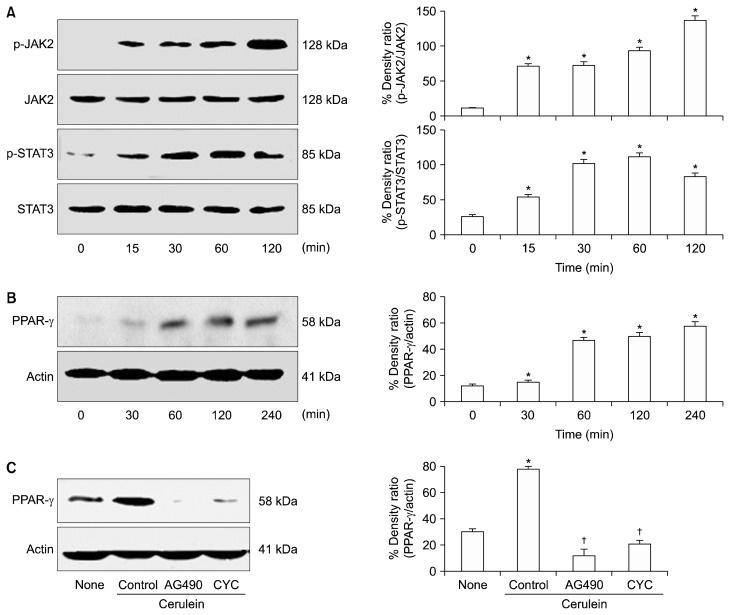
Figure 1.
The levels of JAK2/STAT3 and PPAR-γ in cerulein-stimulated AR42J cells with or without AG490 or cycloheximide (CYC). (A, B) The cells were stimulated with cerulein (10−8 M) at various time points. (C) The cells were pretreated with AG490 (40 μM) or CYC (100 μg/mL) for 1 hour and then stimulated with cerulein (10−8 M) for 2 hours. The specific protein levels in the whole cell extracts were determined by Western blot analysis and expressed as a percentage density ratio. The phosphorylated levels of JAK2 and STAT3 proteins were compared to the respective total protein levels (A), and PPAR-γ protein levels were normalized with those of the loading control actin (B, C). All values are expressed as means ± SEM of four independent experiments. *P < 0.05 vs. none (untreated cells); †P < 0.05 vs. control (cells treated with cerulein alone).

