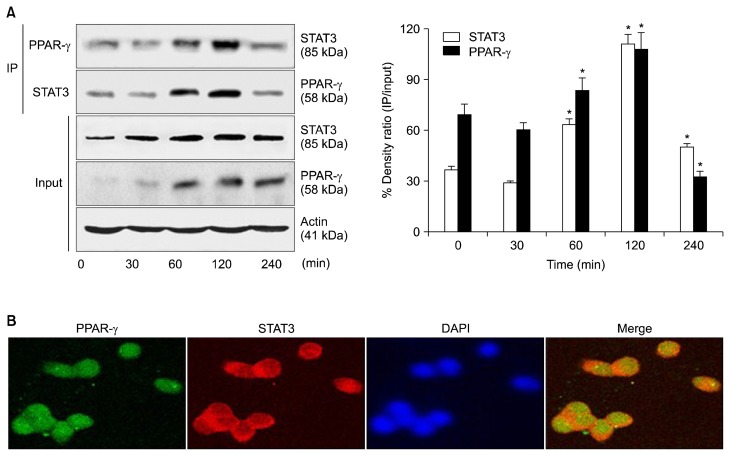
Figure 2.
Binding of PPAR-γ to STAT3 in cerulein-stimulated AR42J cells. (A) The cells were stimulated with cerulein (10−8 M) for the indicated periods. Whole cell extracts were subjected to immunoprecipitation (IP) with an anti-PPAR-γ antibody (first panel) or anti-STAT3 antibody (second panel), followed by Western blotting with an anti-STAT3 antibody or anti-PPAR-γ antibody. The samples (input) were subjected to SDS-PAGE and analyzed by Western blot analysis using an anti-STAT3 antibody (third panel), anti-PPAR-γ antibody (fourth panel), or anti-actin antibody (fifth panel). The protein level was expressed as the percentage density ratio of immunoprecipitated STAT3 to input STAT3 or immunoprecipitated PPAR-γ to input PPAR-γ. All values are expressed as means ± SEM of four independent experiments. *P < 0.05 vs. corresponding 0 hour. (B) Cells were stimulated with cerulein (10−8 M) for 2 hours on Lab-TeK chamber slide glasses. The cells were fixed with cold acetone, washed with PBS, and then incubated with anti-PPAR-γ and anti-STAT3 antibodies for 1 hour. After washing with PBS, the cells were incubated with the secondary antibodies for 1 hour and covered with the Vectashield antifade medium containing 4′,6-diamidino-2-phenylindole (DAPI). The region stained with fluorescein isothiocyanate- or rhodamine-labeled secondary antibody was detected as green or red, respectively. PPAR-γ (green) and STAT3 (red) were merged on a single screen (Merge). DAPI staining was used for nuclear quantification.

