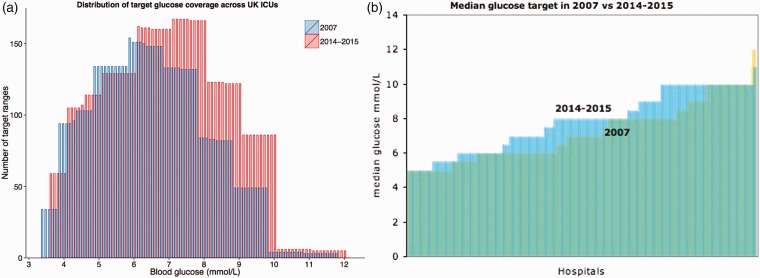
Figure 1.
(a) Each bar represents the frequency with which each glucose target value occurs within the ranges of each intensive care unit or the degree of overlap of ranges i.e. glucose values from 7 to 8 mmol/L were the most frequently seen values in 2014–2015 and 6 to 7 mmol/L in 2007. (b) Median glucose targets from different hospitals. The yellow bars represent glucose targets in 2007; the blue bars represent glucose targets in 2014–2015.

