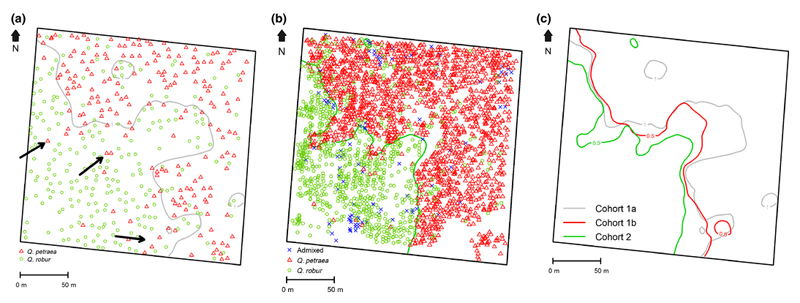
Fig.1.
Spatial distribution of the trees in the three cohorts and contour lines of the two species.
All trees of all cohorts were mapped by recording their GPS coordinates, using post processed differential corrections.
a Cohort 1a
Mapping of the contour line between Q. petraea and Q. robur was done by plotting kriging interpolated values of PCA1=1 (First principal component of the leaf morphology analysis, Methods S4). Admixed trees were not considered for the calculation of the contour line. Arrows indicate hotspots where Q. petraea expanded.
b Cohort 2
Mapping of the contour line between Q. petraea and Q. robur was done by plotting kriging interpolated values of q=0.5 (q: value of the admixture coefficient). Admixed trees were not considered for plotting the contour line.
c Contour lines between Q. petraea and Q. robur in the three cohorts.
Contour lines of cohort 1a and cohort 2 are reproduced from Fig.1a and Fig. 1b. Mapping of the contour line in cohort 1b was done by plotting kriging interpolated values of q=0.5 in cohort 1b (q: value of the admixture coefficient). Admixed trees were not considered for plotting the contour line.

