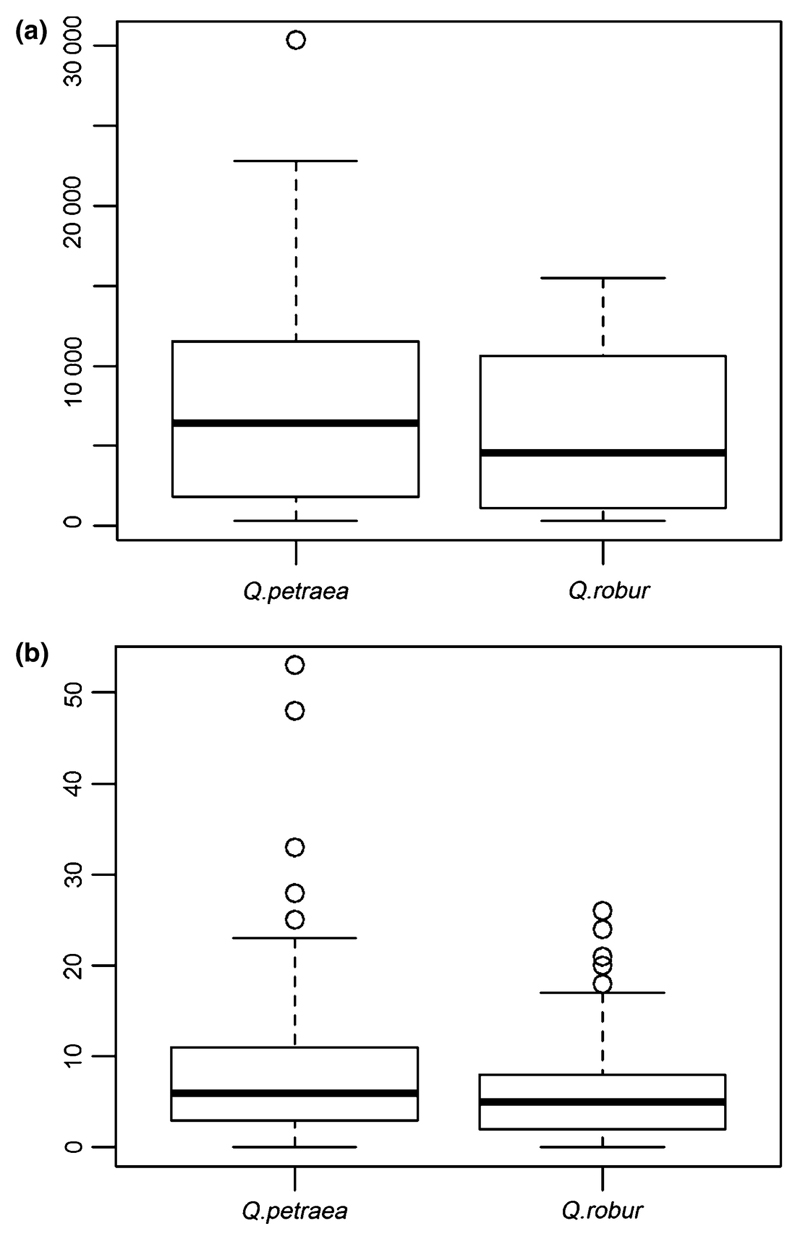
Fig. 3.
Box plot of sapling density and relative reproductive success in Q. petraea and Q. robur.
a Sapling density (cohort 2).
Sapling density was assessed in 49 square survey plots distributed according to a grid system throughout the study stand. The area of each plot was 25 m2 on average and all saplings present in a given plot were counted. Fig. 3a shows the variation of sapling density across the survey plots. The bold horizontal line in the box indicates the median value of the densities, the bottom and top of the box correspond to the 1st and 3rd quartile of the densities. Horizontal lines at the extremities delimit 1.5 times the interquartile range above the 3rd quartile and below the 1st quartile. Circles correspond to outlier densities.
b Relative reproductive success of parental trees in cohort 1b.
Relative reproductive success was calculated for each parent tree using parentage analysis comparing saplings of cohort 2 and parental trees of cohort 1b (see text). Fig 3b shows the variation of the number of offspring between the parental trees (these numbers are relative to the sampling strategy, and are not absolute numbers). The bold horizontal line in the box indicates the median value of the reproductive success, the bottom and top of the box correspond to the 1st and 3rd quartile. Horizontal lines at the extremities delimit 1.5 times the interquartile range above the 3rd quartile and below the 1st quartile. Circles correspond to outlier values of reproductive success.

