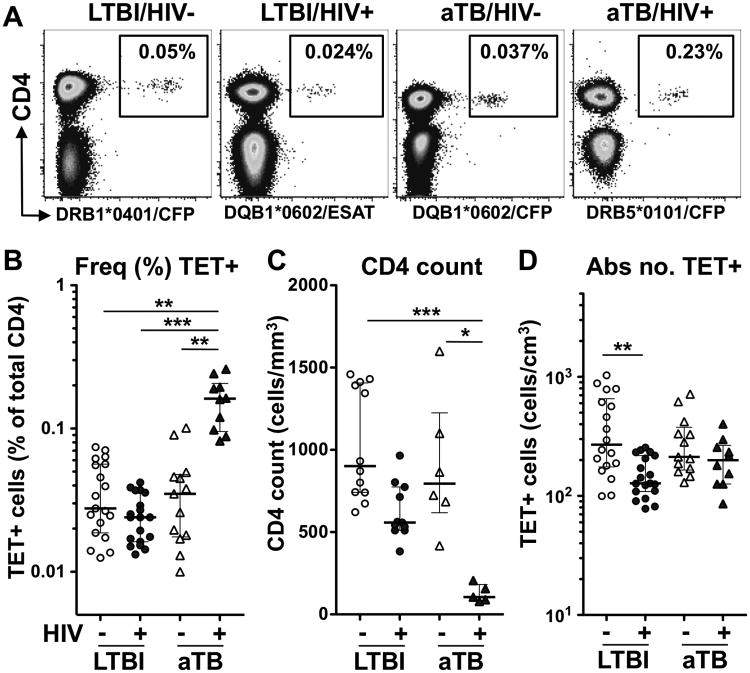
Fig. 1. Identification of Mtb-specific MHC class II tetramer (TET) responses in individuals with HIV and/or active TB.
A- Representative examples of TET+ responses in each clinical group. The frequency of TET+ cells is expressed as a percentage of total CD4+ T cells. B to D: Frequency of TET+ cells (B), absolute CD4+ T cell count (C) and absolute number of TET+ cells (D) in each clinical group (n=13 LTBI/HIV-, n=11 LTBI/HIV+, n=6 aTB/HIV- and n=5 aTB/HIV+). Bars represent the median and interquartile range. Statistical comparisons were performed using a one-way ANOVA Kruskal-Wallis test. *<0.05, **<0.01, ***<0.001.

