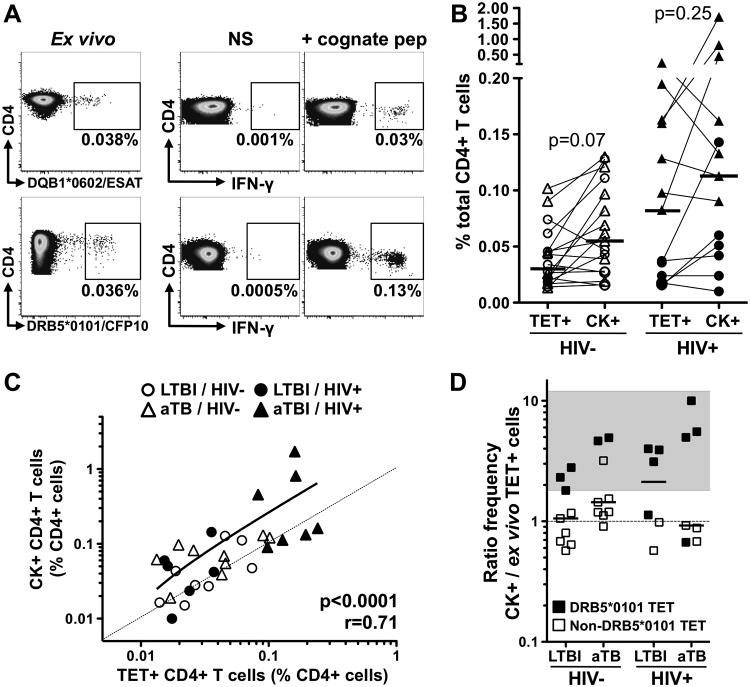
Fig. 5. Cytokine responsive potential of Mtb-specific MHC class II tetramer+CD4+ T cells according to HIV and TB disease status.
A-Representative examples of the frequency of TET+ cells and IFN-γ response to cognate peptide in two LTBI/HIV- individuals. NS: No Stimulation. B- Comparison of the frequencies of ex vivo TET+CD4+ T cells and cytokine+ (CK+) cells in response to cognate peptide in HIV- and HIV+ individuals (n=17 and n=13, respectively). The frequency of Mtb-specific CK+CD4+ T cells is defined as the frequency of cells expressing IFN-γ, IL-2 or TNF-α in response to cognate peptide after background (NS) subtraction. Bars represent medians. Triangles represent individuals with active TB. C- Association between the frequency of ex vivo TET+CD4+ T cells and CK+CD4+ T cells in response to cognate peptide. The dotted line represents a slope of 1. Correlations were tested by a two-tailed non-parametric Spearman Rank test. D- Ratio of the frequency of CK+CD4+ T cells/the frequency ex vivo TET+CD4+ T cells in each clinical group. Black symbols indicate DRB5*0101CFP-1051-65 responses. The grey area highlights individuals with a CK+/TET+ ratio ≥ 1.8. Statistical comparisons were performed using a Wilcoxon matched pairs test.

