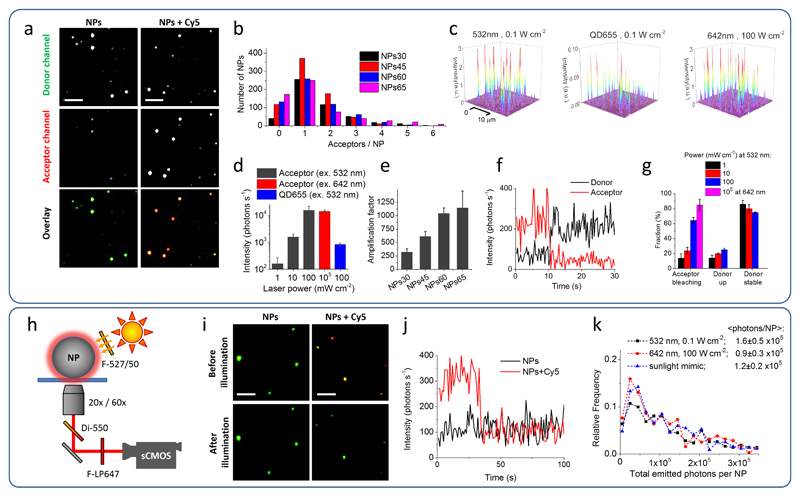
Figure 5. Single-particle evaluation of nano-antennas.
(a) Wide-field fluorescence microscopy images of NPs. NPs60 containing 30 wt % R18/F5-TPB without (left panels) and with ∼1.3 Cy5 (DiD) acceptors per NP (donor:acceptor ratio is 10,000:1, right panels). The laser excitation was at 532 nm (power density 0.1 W cm-2). Both channels are represented at the same intensity scale. Overlay images represent false colour composite of donor (green) and acceptor (red) channels. Scale bar, 3 μm. (b) Histogram of the number of acceptors per NPs calculated from single-molecule photobleaching events using excitation at 642 nm (100 W cm-2). (c) 3D representation of wide-field TIRF images of acceptor emission from NPs60 containing ∼1.3 Cy5 acceptors per NP under illumination at 532 nm (0.1 W cm-2), under direct excitation of the acceptor at 642 nm (100 W cm-2) and of QD655 under illumination at 532 nm (0.1 W cm-2). The integration time was 30.53 ms. (d) Absolute fluorescence intensity of the acceptors in single NPs60 excited at 532 or 642 nm in comparison to that of QDs655. (e) Amplification factor of acceptor emission for antennas of different sizes with 1-2 acceptors per NP. (f) Representative single-particle trace excited at 532 nm (1 mW cm-2). (g) Fraction of single acceptor bleaching events and the response of donor dyes to these events. (h-k) Scheme of experimental setup and obtained results, using excitation that mimics direct sunlight. (i) Single-particle FRET microscopy with overlaid donor (green) and acceptor (red) channels under sunlight excitation mimics using NPs60 containing ∼1.3 Cy5 per NP before and after 5-min illumination. Scale bar, 3 μm. (j) Single-particle traces at the acceptor channel for NP60 without and with Cy5 acceptor. (k) Histogram of the total photons emitted before photobleaching for the single acceptors excited directly or through NPs60 nano-antenna. All errors are s.e.m. (n ≥ 3).

