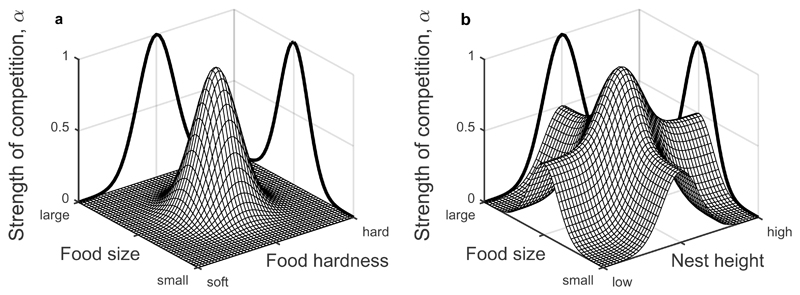
Figure 1.
Competition (A) within and (B) across resource types based on the overlap of resource utilisation functions (equations (3) and (6)). Panels show how the strength of competition (α) varies for a species whose resource utilisation function peaks at the centre of the x-y plane. The black curves show the (unscaled) components of competition on each axis. (A) Resource utilisation functions combine multiplicatively within each resource type (here: food size and food hardness, more generally, for substitutable regulating factors) and so the competition kernel is a multivariate Gaussian. (B) Resource utilisation functions combine additively across different resource types (here: food size and nest height, more generally, for non-substitutable regulating factors) as they are independent of each other; hence differentiation within a single resource type has no impact on competition among other resource types. Note that the components of competition on each axis are rescaled when combined so that 0≤αij≤1.

