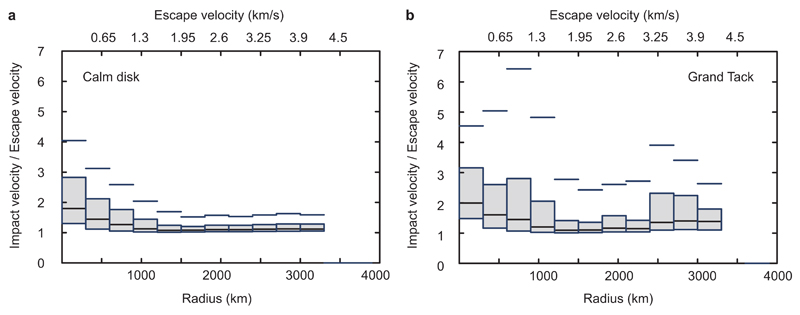
Extended Data Figure 6.
Variation in velocity of individual impacts (normalized by target body escape velocity) as a function of target body radius. Central line denotes median value, shaded box encompasses region spanning 25th-75th percentiles, upper lines denote 90th percentile. Bulk density assumed to be 3000 kg m-3.

