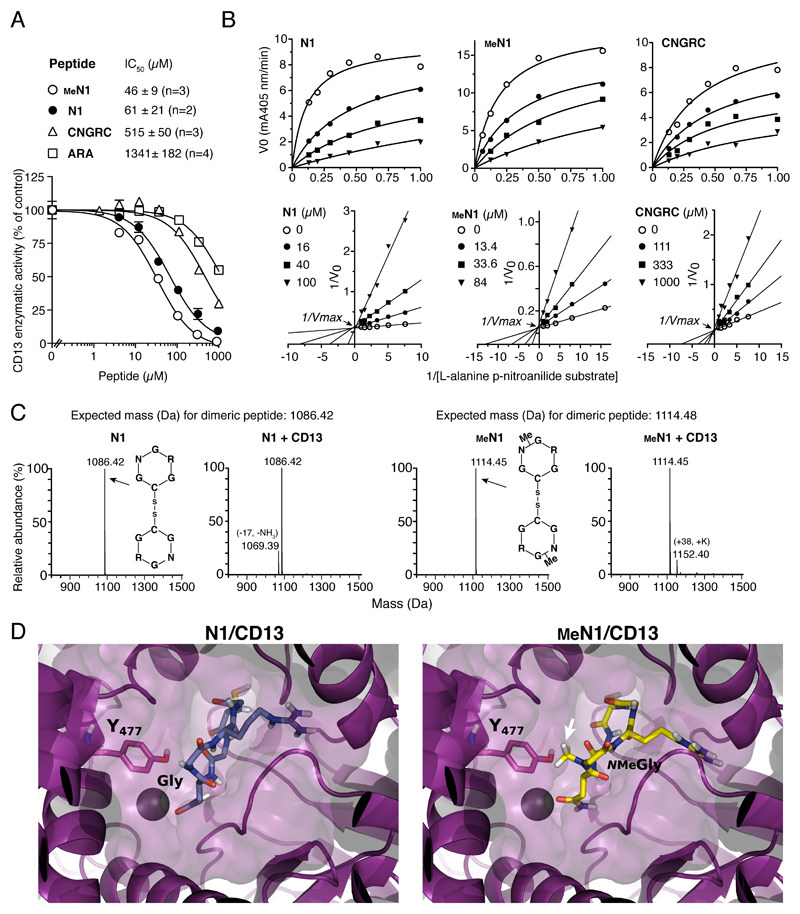
Figure 3. N1 glycine N-methylation does not prevent CD13 recognition.
A) Effect of different peptides on CD13 enzymatic activity. IC50, peptide concentration that inhibit 50% of activity; n, number of independent experiments (each in duplicate). A representative experiment is shown (mean ± standard error, SE).
B) Steady state kinetic analysis of CD13 in the presence of various amounts of substrate and peptides. Representative plots of initial velocity (V0) versus substrate concentration (upper panels) and double reciprocal plot (lower panels). The inhibitory constant (Ki) values reported in each plot are the result of two independent experiments (mean ± SE).
C) MS analysis of N1 and MeN1 (30 µM) after incubation with or without CD13. No changes in the molecular mass were observed, suggesting that both peptides are resistant to degradation by CD13.
D) Representative decoy poses of N1 (left panel) and MeN1 (right panel) with CD13. CD13 is shown as purple cartoon and surface. The Y477 of CD13 interacting with G or NMeG is highlighted in sticks and labeled with the one-letter code. The arrow indicates the N-methylation. Zn2+ is represented as a sphere; peptides are represented as sticks.

