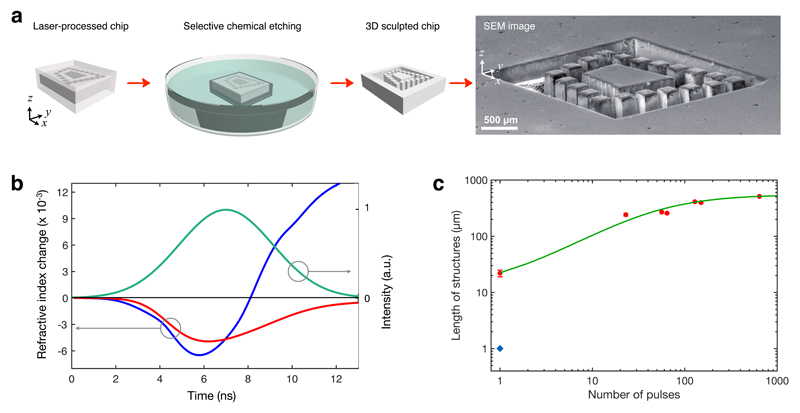
Figure 2. Selective chemical etching and theoretical modelling.
(a) Illustration summarises single-step selective chemical etching for removal of the laser-processed volumes. The SEM image shows experimental realisation of Penrose Stairs16. (b) Simulation results show self-induced refractive index change, comprised of thermal nonlinearity (positive Δnthermal) and free carrier induced refractive index change (negative ΔnFCI) for a single pulse (green curve). The red curve shows the self-induced refractive index change for a single beam focused in Si. The blue curve shows the index change for the two counter-propagating beams. The thermal nonlinearity is dominant in the latter, enabling beam collapse and modification in Si. (c) Prediction of our analytic model for structure elongation with each pulse is compared with experiments. Data points represented with red circles were created using a lens with NA of 0.55 and the isolated data point represented by a blue diamond was created using an objective with NA of 0.75. In all figures, z-axis is the optical axis.

