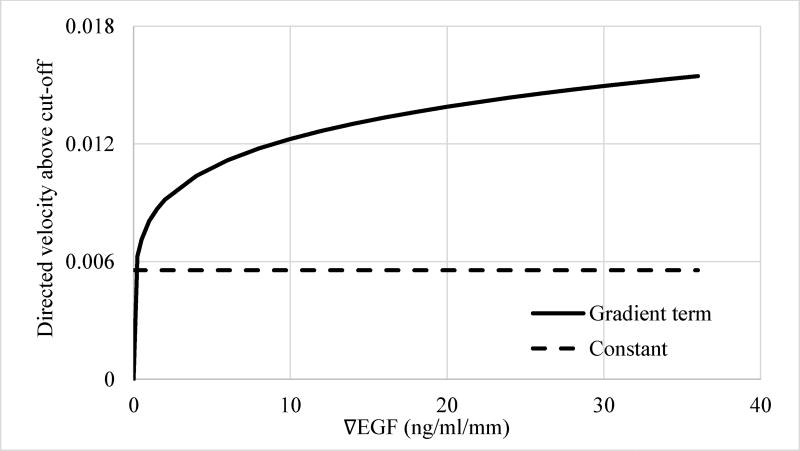
Figure 12.
Contribution of the different terms of the regression model Model 3G (Table 4) to the instantaneous directed velocity of cells that fall above cut-off, H%v,d. Dashed line, constant term and solid line, ligand gradient term. The exponent of the ∇EGF term is 0.181 indicating a nonlinear relationship.

