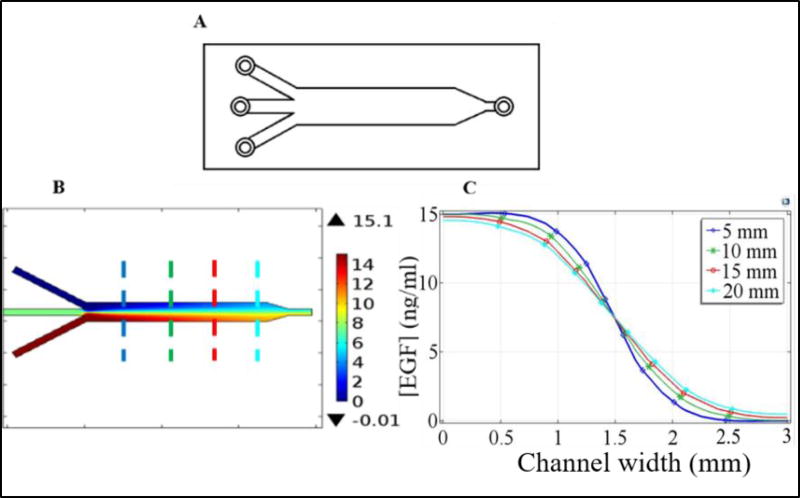
Figure 3.
(A) Schematic diagram of the y-channel device. Middle inlet was sealed and not used and ligand was injected through the lower inlet. (B) Steady-state EGF distribution within the device when the input EGF concentration was 15 ng/ml. Cellular motilities were imaged at the center axis at four different downstream positions along the device after the y-junction. Size of the imaged area was approximately 1 mm by 1 mm. Dashed lines indicate the imaged positions: blue (5 mm), green (10 mm), red (15 mm), and cyan (20 mm) where the numbers in the paranthesis refer to the distance from the y-junction. (C) EGF concentration along the direction perpendicular to flow at the imaged positions which are marked with dashed lines in part (B). Imaged area was centered at the middle of the channel (i.e., around the 1.5 mm point in the graph (C)). As can be seen, formed gradient at the imaged areas are almost linear and vary along the length of the device. Results shown in parts (B) and (C) were computed using the COMSOL program with the conditions detailed in the text.

