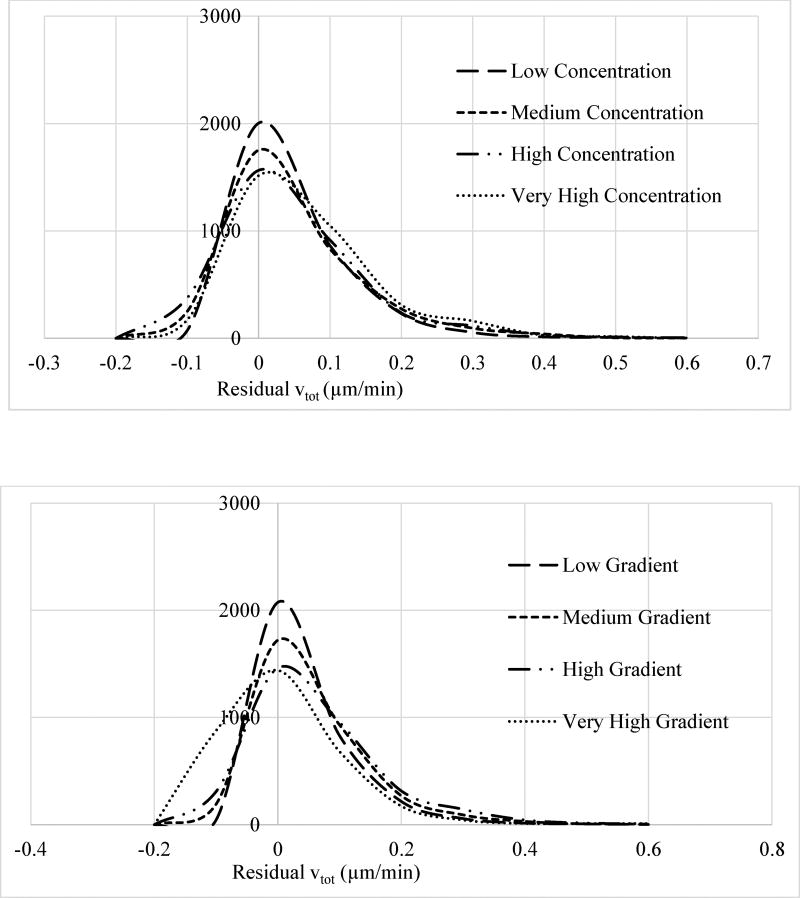
Figure 6.
Histogram of the average total velocity vtot residual distributions for the four cell groups described in main text) which were defined based on the levels of cells’ exposure to (top) EGF concentration and (bottom) EGF gradient. As discussed in the main text, EGF concentration range (top) for the four groups were: low (0–8 ng/ml), medium (8–16 ng/ml), high (16–24 ng/ml), and very high (24–32 ng/ml). EGF gradient range (bottom) for the four groups were: Low (0–9.5 ng/ml/mm), medium (9.5–19 ng/ml/mm), high (19–28.5 ng/ml/mm), and very high (28.5–38 ng/ml/mm). Histograms were normalized separately for each group and y-axis has arbitrary units. Apart from widening at high ligand concentration or gradient levels, residual distributions for the groups were very similar with the same peak positions and distribution shapes further confirming the unbiased model fit.

