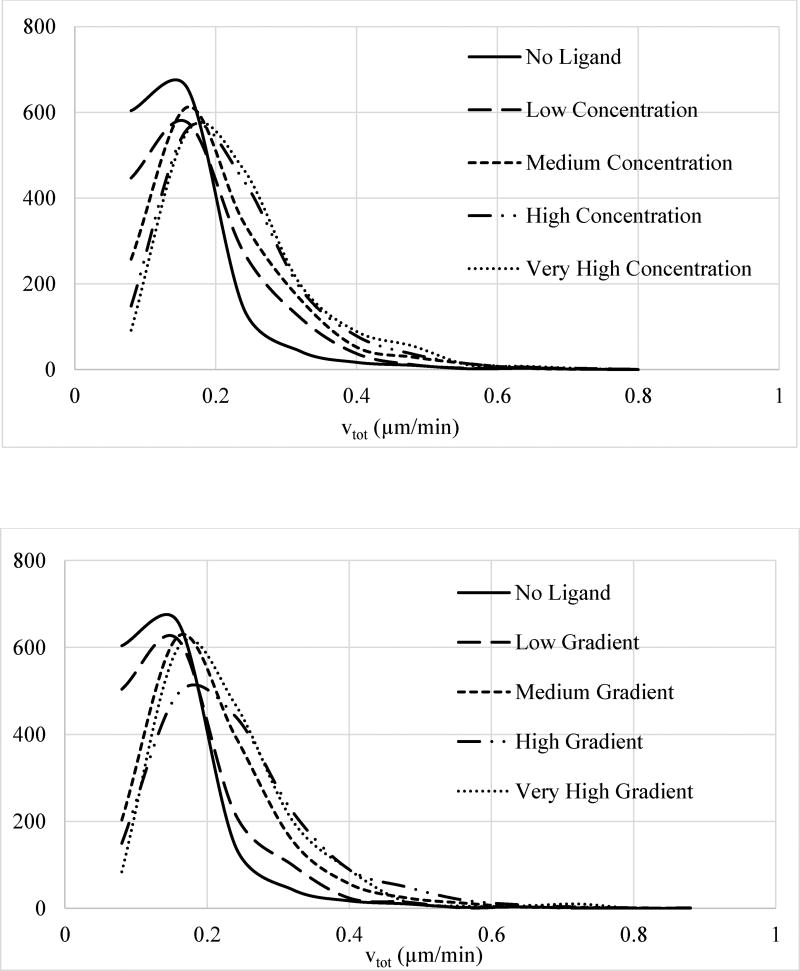
Figure 7.
Normalized histogram distribution of instantaneous total velocities vtot for cells exposed to different levels of (top) EGF concentration and (bottom) EGF gradient. Histograms were normalized separately for each group and y-axis has arbitrary units. As discussed in the main text, EGF concentration range (top) for the four groups were: low (0–8 ng/ml), medium (8–16 ng/ml), high (16–24 ng/ml), and very high (24–32 ng/ml). EGF gradient range (bottom) for the four groups were: Low (0–9.5 ng/ml/mm), medium (9.5–19 ng/ml/mm), high (19–28.5 ng/ml/mm), and very high (28.5–38 ng/ml/mm). Distributions for the groups are shown with: No ligand, solid line; low stimulation, long dash line; medium stimulation, dash line; high stimulation, long dash-dot-dot line; and very high stimulation, dot line. Legends for the curves are also reported in the figures.

