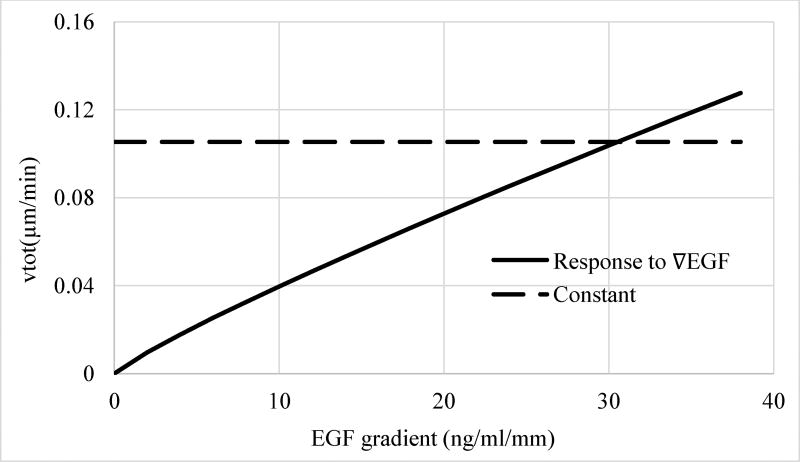
Figure 8.
Contribution of the different terms of the regression model Model 3G (Table 1) to the instantaneous total velocity vtot of cells. Dashed line, constant term and solid line, ligand gradient term. The exponent of the ∇EGF term is 0.876, i.e., close to 1, indicating a near linear relationship.

