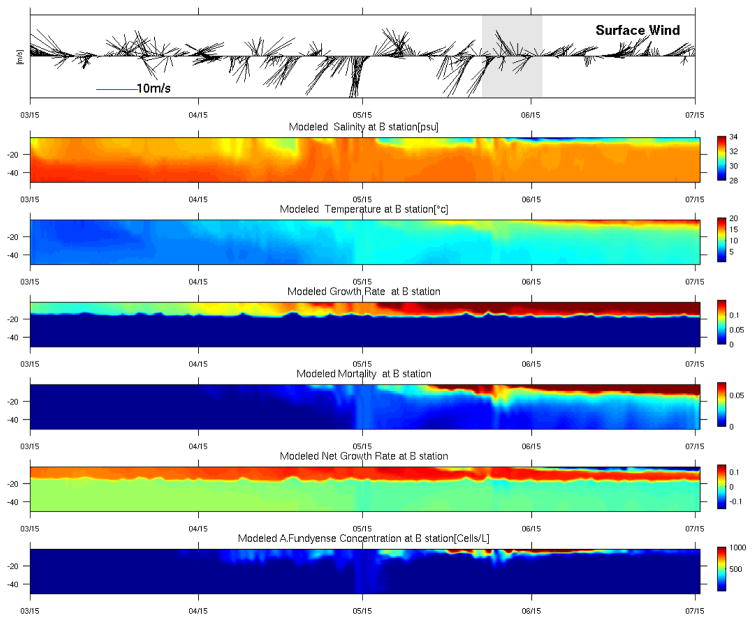
Figure 11.
Time evolution of vertical profiles of key physical and biological parameters at GoMOOS mooring B. The first panel shows the observed wind vector time series. The following panels indicate model simulated temperature, salinity, growth rate, mortality, the net growth rate, and A.fundyense concentration, respectively. Vertical depths are in unit of meter.

