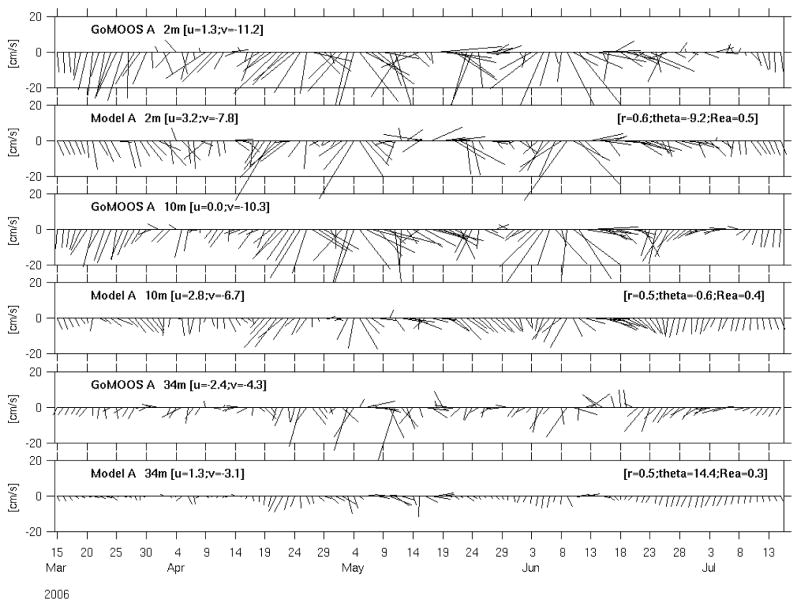
Figure 5.
Comparisons of simulated and observed surface (2m) and sub-surface (10m, 34m ) currents at GoMOOS mooring A. Current time series are sampled every other day for better visualization. Each vector current time series is accompanied by its seasonal mean east and north velocity components (left-hand couplet), and each model/data comparison is quantified by its complex correlation coefficient, phase angle (or angular deviation of the model vectors from the data vector measured counterclockwise), and regression coefficient (right-hand triplet).

