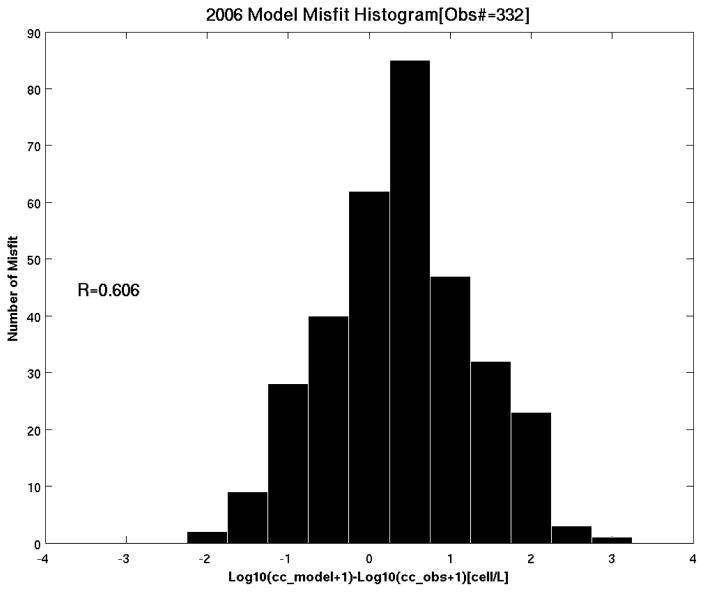
Figure 9.
Histogram of point-by-point misfit between observed and simulated surface cell concentration at a total of 332 stations. A logarithm scaling method is used for better visualization. R denotes the overall spatial correlation coefficient between the observed and simulated cell concentrations, serving as another quantitative way of measuring the spatial distribution similarity

