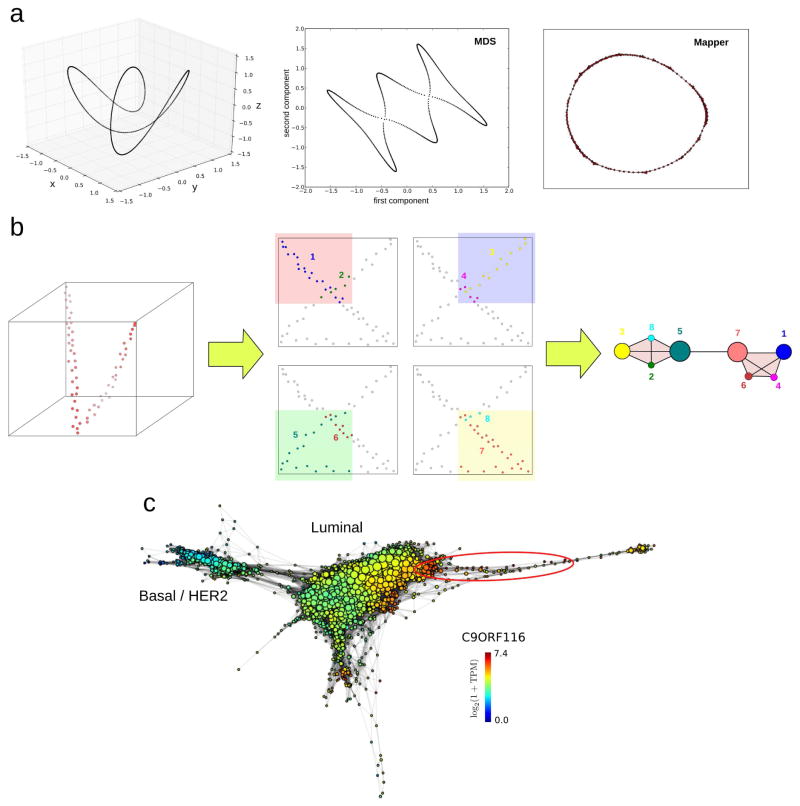
Figure 4. Dimensional reduction of phase spaces.
(a) Commonly used algorithms for dimensional reduction produce low-dimensional representations which fail to preserve local relationships of the original space. Points close to each other in these representations are not necessarily close in the original space. In this figure a twisted circular trajectory in three dimensions (left) has been reduced to two dimensions using multidimensional scaling (MDS) (center), and the topological method Mapper (right). MDS leads to additional loops which are not present in the original space. To the contrary, Mapper preserves the topological features of the original space. (b) The Mapper algorithm [36] builds upon any given dimensional reduction algorithm and produces a low-dimensional simplicial complex representation of the data where local relationships of the original space are preserved. In this example a 2-dimensional projection of a twisted linear trajectory in 3-dimensions (left) produces a “loop” that is not present in the original space. The Mapper algorithm builds on top of this projection by covering the plane with overlapping patches and clustering in the original space the points that lie within each patch. The procedure is illustrated here with four patches (center). Points in each cluster are represented with the same color, and clusters are numbered from 1 to 8. In the low-dimensional Mapper representation, a node is assigned to each cluster. Node sizes are proportional to the number of points in the cluster. If two clusters intersect, the corresponding nodes are connected by an edge. The resulting simplicial complex representation (right) has the same topology than the original high-dimensional linear trajectory, with no loops. (c) Mapper representation of the RNA-seq data of 768 breast invasive carcinoma tumors from The Cancer Genome Atlas (TCGA) [48], labelled according to expression levels of C9ORF116. Basal, HER2, and luminal tumor subtypes are indicated. The group of ER+-patients identified in [10], with excellent survival and high expression levels of C9ORF116 and DNALI1, is encircled in red. Representation built using the implementation of Mapper by Ayasdi Inc, based on a two-dimensional nearest-neighbor graph projection and correlation distance between expression profiles.

