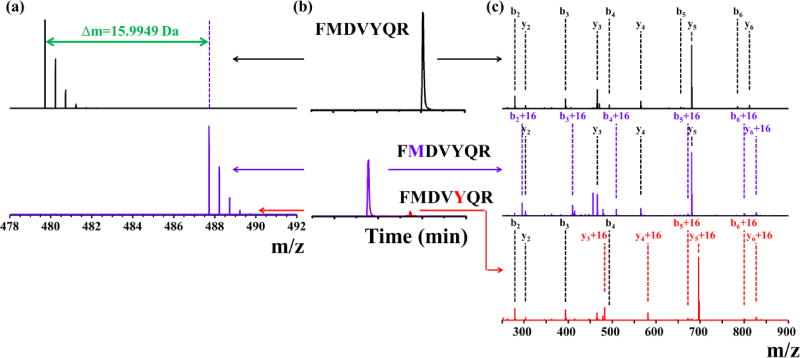
Figure 1.
MS (a) and XIC peaks (b) and product-ion (MS/MS) (c) spectra of peptide V17-23 of VEGF, both unmodified (black traces) and modified (blue and red traces). Blue traces in (a) represent MS spectra of oxidized peptide. Blue and red traces in (b) and (c) represent XIC peak or product-ion spectra of peptide oxidation on residue M and Y, respectively.

