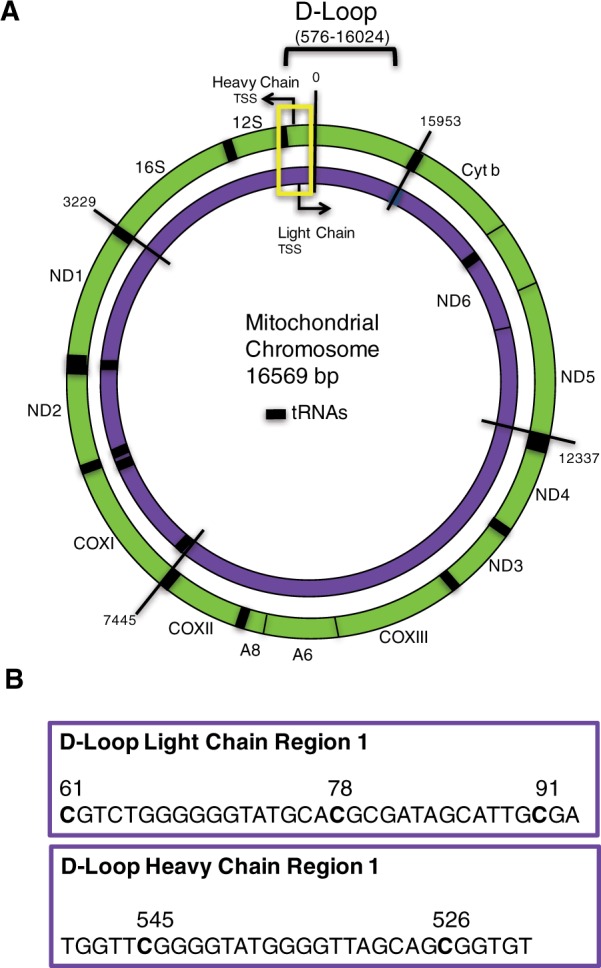
Figure 1.

Map of mitochondrial genome and sequences on the MT chromosome used for methylation analysis. The outer circle (green) represents the heavy chain MT chromosome and the inner circle (purple) being the MT light chain ( A ). The 16,569 base chromosome is numbered at various segments for orientation. Coding genes are labeled on the H & L chains and the 12S and 16S ribosomal RNA genes. tRNAs are represented by thick black bars. The D-Loop control region is contained within bases 576–16,024. Yellow rectangle outlines the section of the mitochondrial chromosome within which the methylation assays were designed. The specific MT-chromosomal sequences and CpG sites analyzed in D-Loop are detailed ( B )
