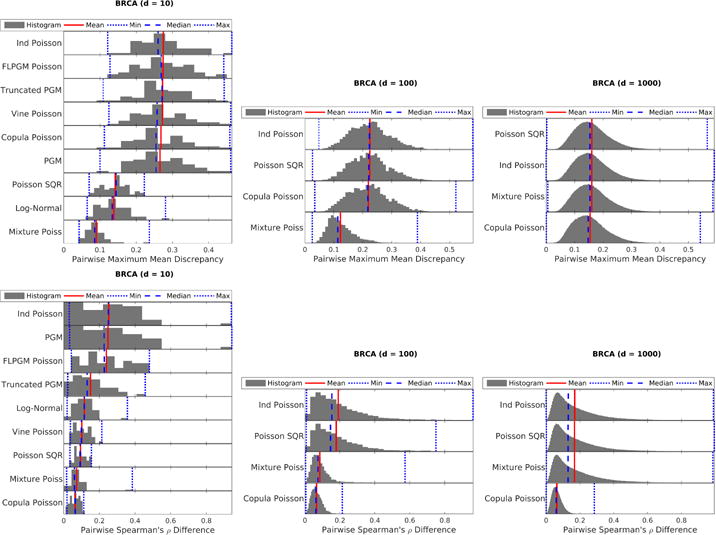
Figure 5.

BRCA RNA-Seq dataset (medium counts and medium overdispersion): MMD (top) and Spearman ρ’s difference (bottom) with different number of variables: 10 (left), 100 (middle), 1000 (right). While mixtures (“Log-Normal” and “Mixture Poiss”) perform well in terms of MMD, the Gaussian copula paired with Poisson marginals (“Copula Poisson”) can model dependency structure well as evidenced by the Spearman metric.
