
Fig 1. Stability of Relative Citation Ratio (RCR) over time.
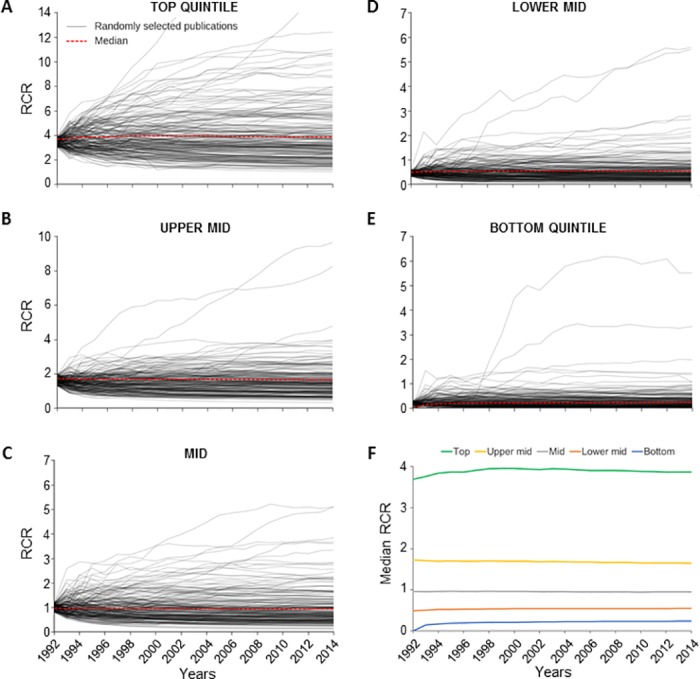
(A–E) Change in RCR over time was determined for individual National Institutes of Health (NIH)-funded articles published in 1991. Articles were assigned to quintiles based on their RCR values in the year after publication (1992); RCR in each subsequent year was calculated. For each quintile, 200 individual articles (gray lines) were chosen at random from the subset in which the 1992 values were within 10% of the median, and the resulting plots are shown. All values are actual and unsmoothed. In (A) through (E), the red line shows the median for the respective quintile. (A) Top quintile, (B) Upper mid quintile, (C) Mid quintile, (D) Lower mid quintile, (E) Bottom quintile, (F) Median RCR in each of the 5 quintiles for all NIH-funded articles published in 1991. See S1 Data.