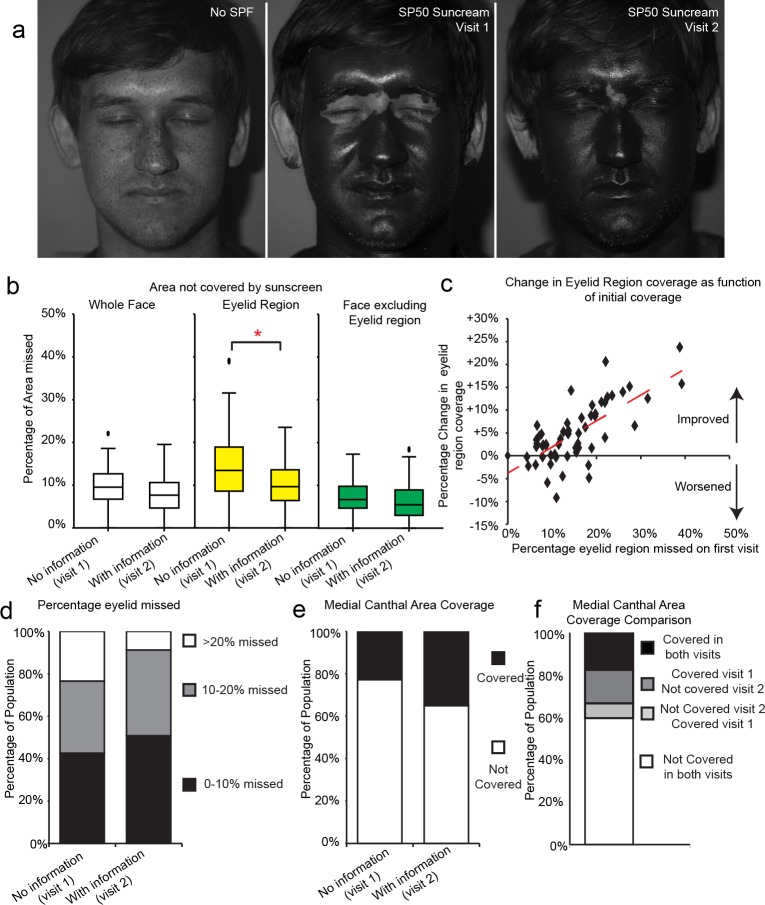
Fig 3. Provision of a simple information sheet improves eyelid coverage.
a) Representative images without SPF (left), after SPF50 application during routine application (visit 1), or after receiving cancer risk information sheet (visit 2). b) Box and whisker plot of percentage of region missed as detected by automated image analysis software. Line represents median, boxes represent 25 to 75th percentile, whiskers 5th and 95th percentile, outliers denoted by black dots, n = 57. * denote significant difference between bracketed groups, p<0.01 Wilcoxon Signed Ranks test. c) Dot plot showing percentage coverage change against initial percentage eyelid area missed for all participants (n = 57). Values above 0 on this plot indicate improved coverage. Pearson correlation coefficient 0.66, p<0.01. d) Bar chart showing percentage of study population who failed to cover either >20% of their eyelid regions (white), 10–20% (grey) or 0–10%. e) Bar chart of percentage of population that either completely covered or failed to cover medial canthal regions. f) Bar chart of medial canthal area coverage comparing on an individual basis coverage in visit 1 and visit 2, x2 p>0.05.

