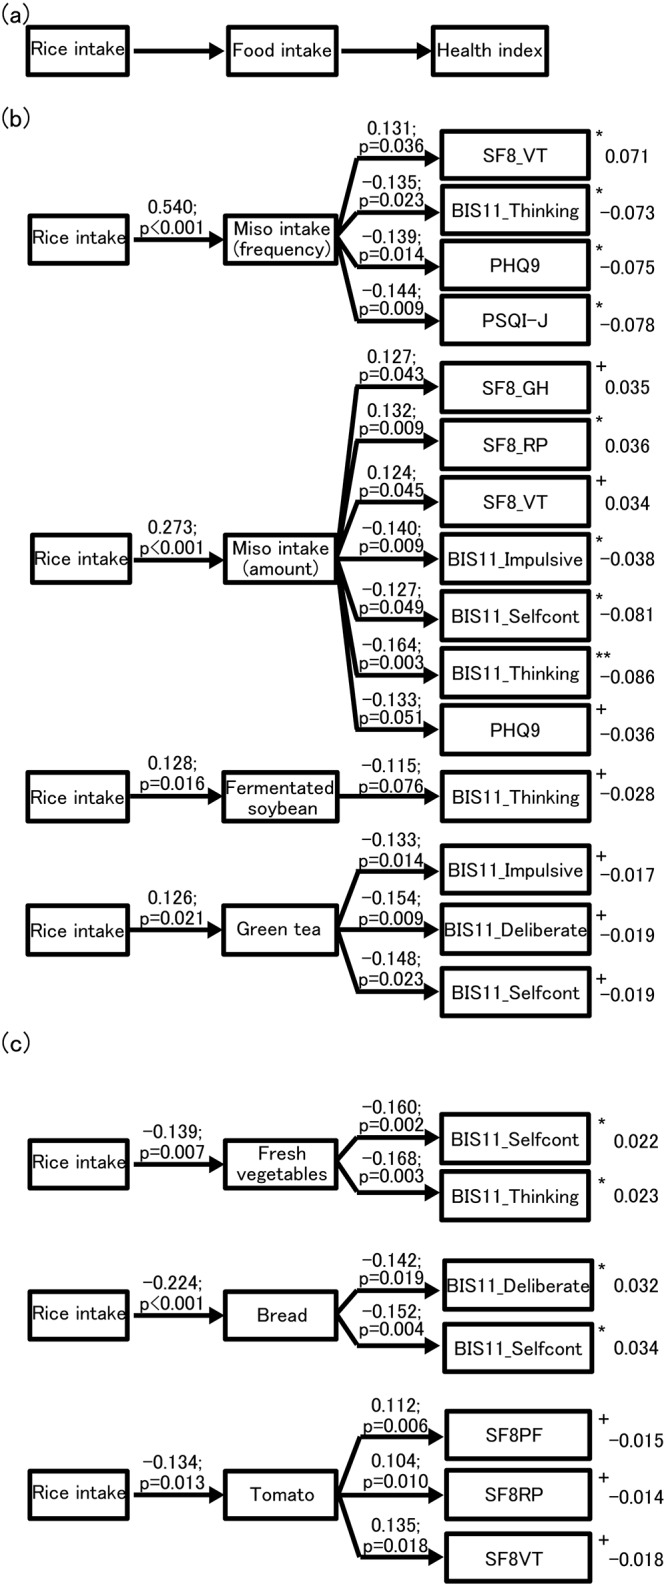
Fig 1. Indirect effects of the associations between rice intake and health.

Structural equation modeling was performed to assess model fit considering “rice intake”, “foods”, and “health indices”. SF-8 GH, general health; SF-8 RP, role—physical; SF-8 VT, vitality; BIS-11, Barratt Impulsiveness Scale-11; BIS-11 Impulsive, subscale of impulsivity; BIS-11 Deliberate, subscale of lack of planning; BIS-11 Selfcont, subscale of lack of self-control; BIS-11 Thinking, subscale of non-planning impulsivity; PHQ9, Patient Health Questionnaire-9; PSQI-J, Pittsburgh Sleep Quality Index, Japanese version. (a) The structure of the model. (b) The fit of the model (rice intake, health indices, and foods whose intake was positively correlated with rice intake). The values on each arrow indicate path coefficients and p-values. Square sums of multiple correlation coefficients are shown to the right of the health indices. (c) The fit of the model (rice intake, health indices, and foods whose intake was negatively correlated with rice intake). The values on each arrow indicate path coefficients and p-values. Square sums of multiple correlation coefficients are shown to the right of the health indices. +p < 0.1; *p < 0.05; **p < 0.01.
