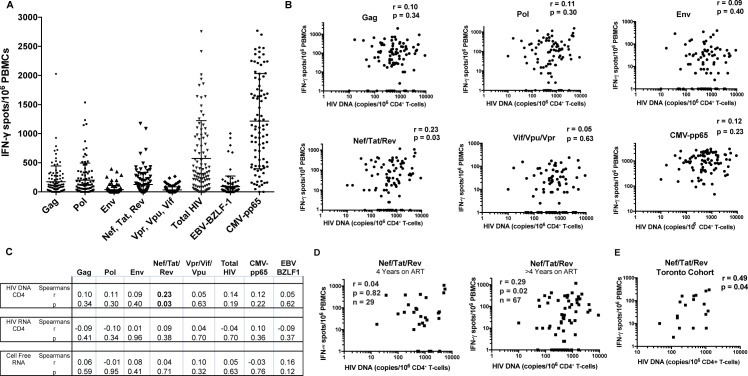
Fig 3. Magnitudes of T-cell responses to peptide pools, and correlations with virologic parameters.
A. Peptide pools were tested in duplicate. CMV pp65 and EBV BZLF1 peptides are included as controls as responses to these other viruses are unlikely to be related to HIV reservoirs. Each data point represents the mean number of spots per 106 PBMCs following background subtraction. Vertical lines and error bars represent mean and standard deviation for each peptide pool. B. Correlations between IFN-γ -producing HIV-specific T-cell responses (as displayed in A) and frequencies of HIV-infected cells as measured by cell associated HIV DNA, with each dot representing a single individual. Spearman’s r and p values are given for each peptide pool. C. Tests for correlations between T-cell responses and additional virologic parameters (cell-associated and cell-free HIV RNA). D. The ELISPOT data set depicted in B were split based on duration of ART (4 years, or >4 years). The results are consistent with the correlation between Nef/Tat/Rev-specific T-cell responses and HIV DNA emerging after years of ART. E. Correlations between IFN-γ -producing HIV-specific T-cell responses and frequencies of HIV-infected cells as measured by cell associated HIV DNA in the Toronto cohort.

