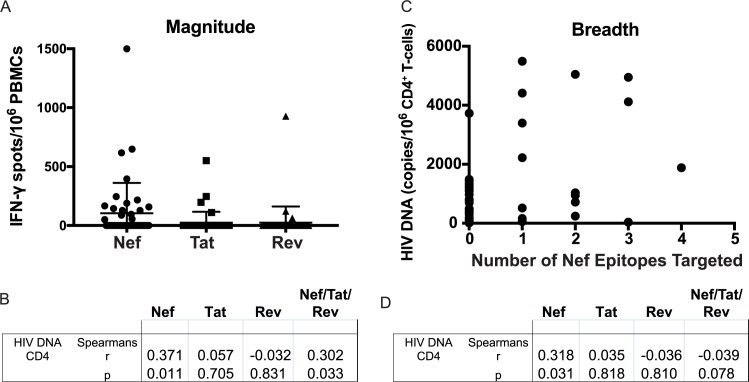
Fig 4. Magnitudes and breadths of Nef/Tat/Rev-specific T-cell responses, and correlations with virologic parameters.
T-cell responses were measured by IFN-γ ELISPOT using a peptide matrix pool strategy (see Methods). A. Total magnitudes of responses to each gene product, calculated as sums of responses to individual matrix pools following background subtraction. Vertical lines and error bars represent mean and standard deviation for each gene product. B. Correlations between T-cell responses (as in A) and frequencies of HIV-infected cells as measured by cell associated HIV DNA. C. The total numbers of Nef epitopes recognized by each individual are shown plotted against frequencies of HIV-infected cells. D. Tests for correlations between breadths of T-cell responses (as in C) and frequencies of HIV-infected cells.

