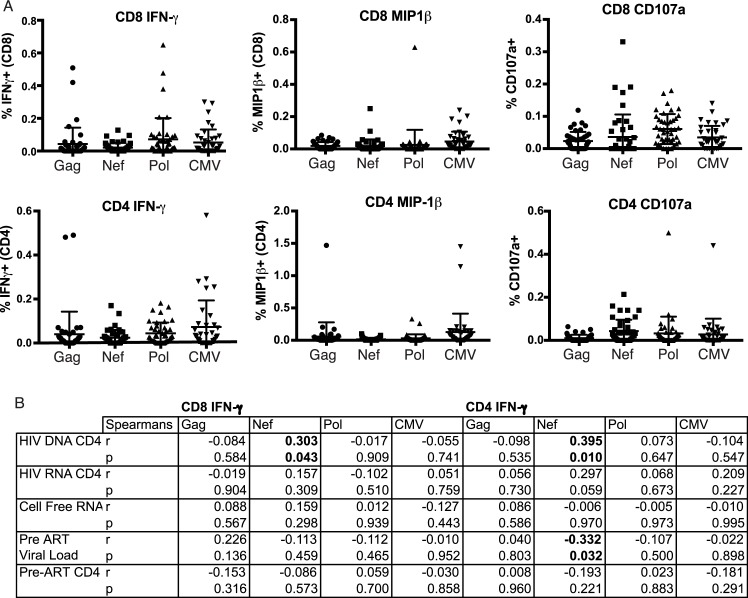
Fig 5. Polyfunctionality of HIV-specific T-cell responses, and tests for correlations with virologic parameters.
A. Shown are frequencies of CD8+ and CD4+ T-cells that responded with the indicated effector functions following stimulation with HIV and CMV peptide pools. Each dot represents the background-subtracted mean response from a given individual (tested in duplicate). Vertical lines and error bars represent mean and standard deviation for each gene product. B. Tests for correlations between responses depicted in A and virologic parameters. Significant associations (p < 0.05) are indicated in bold.

