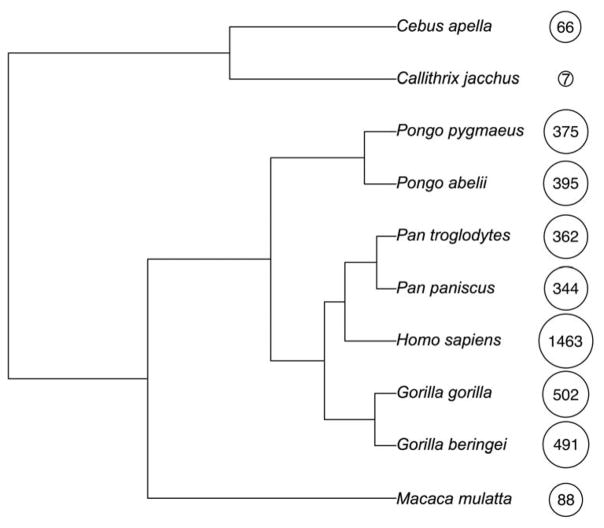
Figure 1. Phylogenetic tree of primates.
Phylogenetic relationships among the great apes and other primate species mentioned. The numbers indicate the endocranial volumes (in cm3, rounded to the nearest whole number) and the size of the circles shows the natural log transformation of the endocranial volumes to demonstrate the diversity in brain size of the primate species. Data from [5,6].

