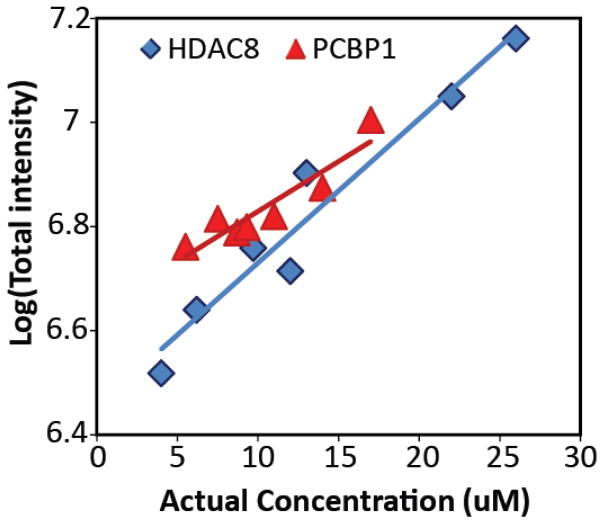
Figure 3.
A plot of the logarithm of nESI-MS intensity for HDAC8 (blue diamonds) and PCBP1 (red triangles), as a function of protein solution concentration following buffer exchange. Linear trend lines from regression analysis are shown. Taken together, these two trend-lines indicate that nESI-MS intensity can be used to confidently determine HDAC8 and PCBP1 concentrations in solution, over the range of concentrations probed, and thus the KD value associated with their complex formation. The variance values associated with the correlation coefficients from the shown trends (R2 = 0.86 for PCBP1 data and 0.78 for HDAC8 data) are carried forward into our analysis of the KD values reported here.

