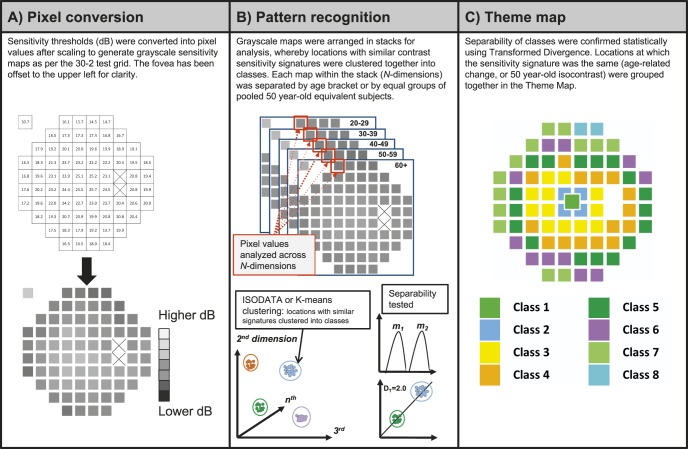
Figure 1.
Method of pattern recognition analysis in the present study. (A) HFA sensitivity thresholds (in dB) were converted into grayscale pixel values (PVs) to obtain a grayscale map. Each square represented one test location within the 30-2. PVs ranged from 0 (darkest, lower dB) to 255 (lightest, higher dB). The two blind spot locations (crossed out) and the background has a PV of 255. (B) Pattern recognition analysis carried out using PCI Geomatica 10. The separabilities between classes were determined using the DT statistic: the class means (e.g., m1 and m2) and distributions were compared across clusters to obtain a DT value, which provides an approximation of the rate of correct classification. (C) Theme maps were generated once classes had a separability of 1.86 or more (>96% probability of correct classification), and were color coded for clarity.

