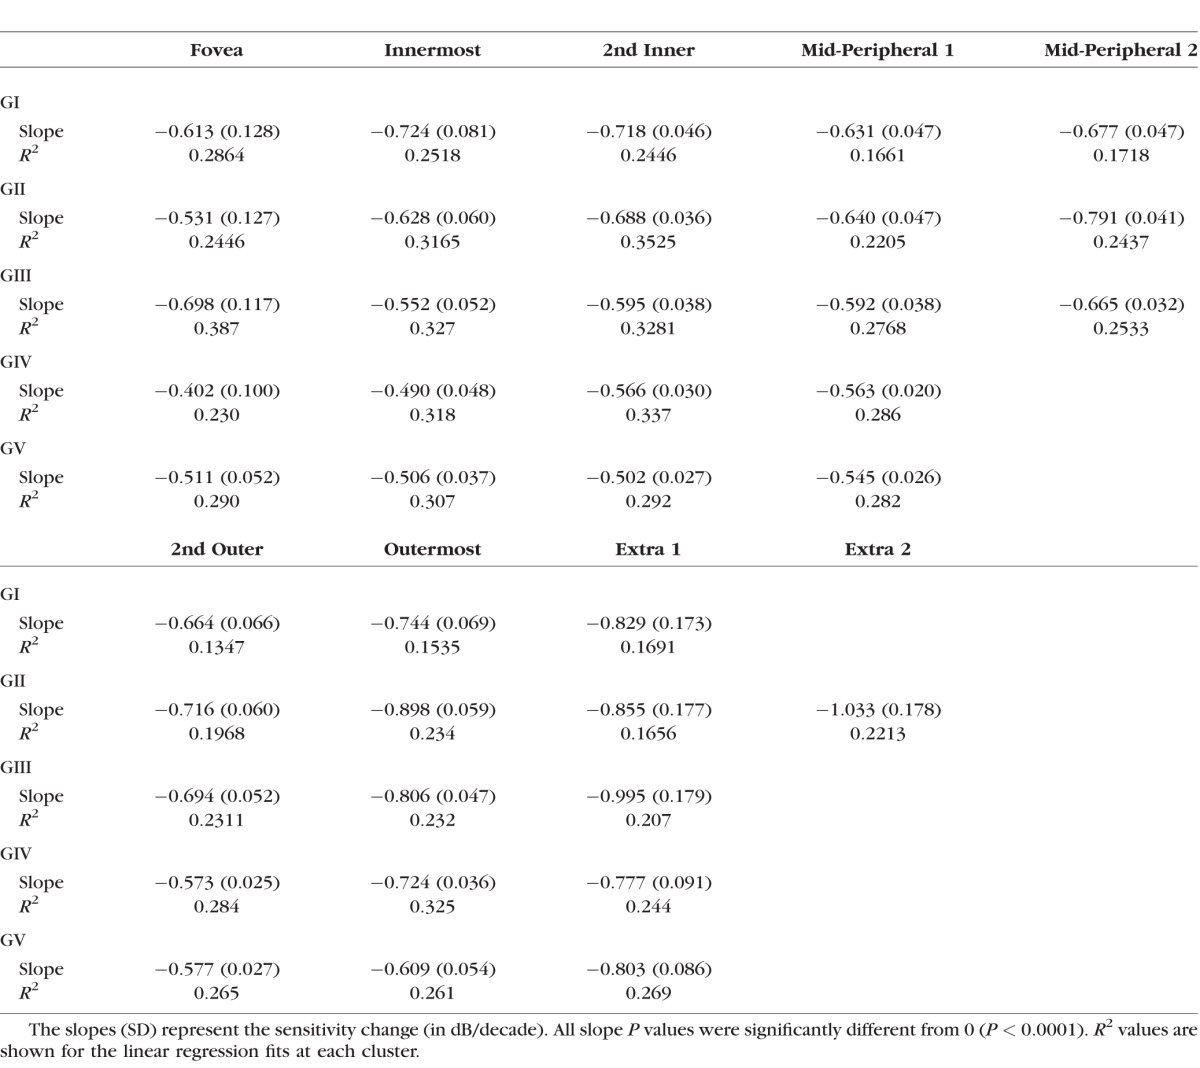
Table 3.
Linear Regression Slopes Following Grouping of Test Locations Based On Pattern Recognition Analysis Theme Maps in Figure 4. Fovea to Mid-Peripheral, and 2nd Outer to Extra Points Results Have Been Divided for Clarity

Linear Regression Slopes Following Grouping of Test Locations Based On Pattern Recognition Analysis Theme Maps in Figure 4. Fovea to Mid-Peripheral, and 2nd Outer to Extra Points Results Have Been Divided for Clarity
