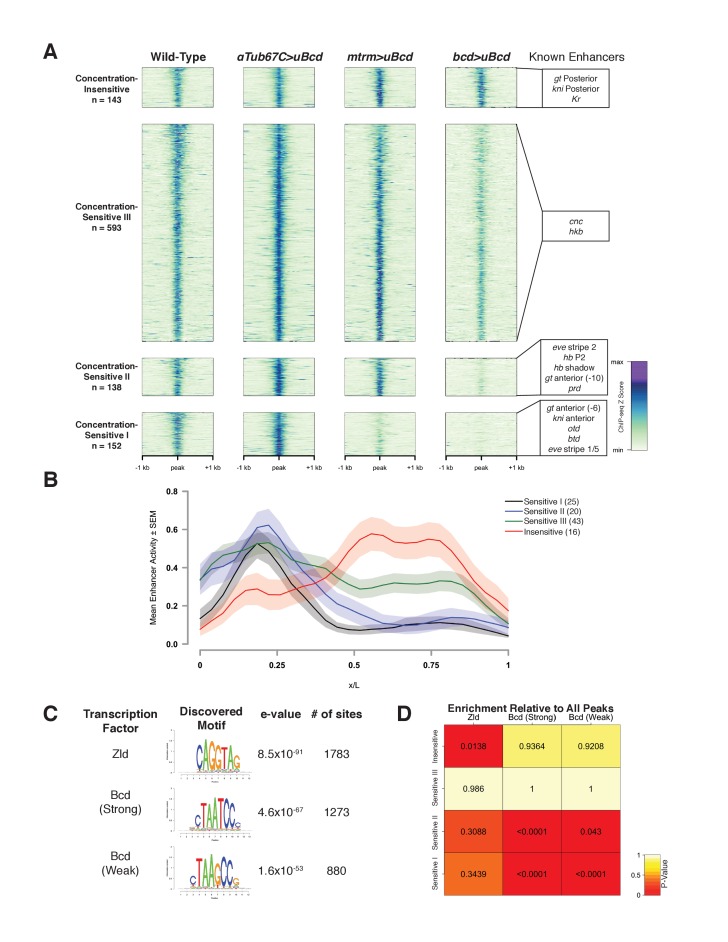
Figure 2. Bcd-bound regions are classified into groups of increasing sensitivity to Bcd concentration.
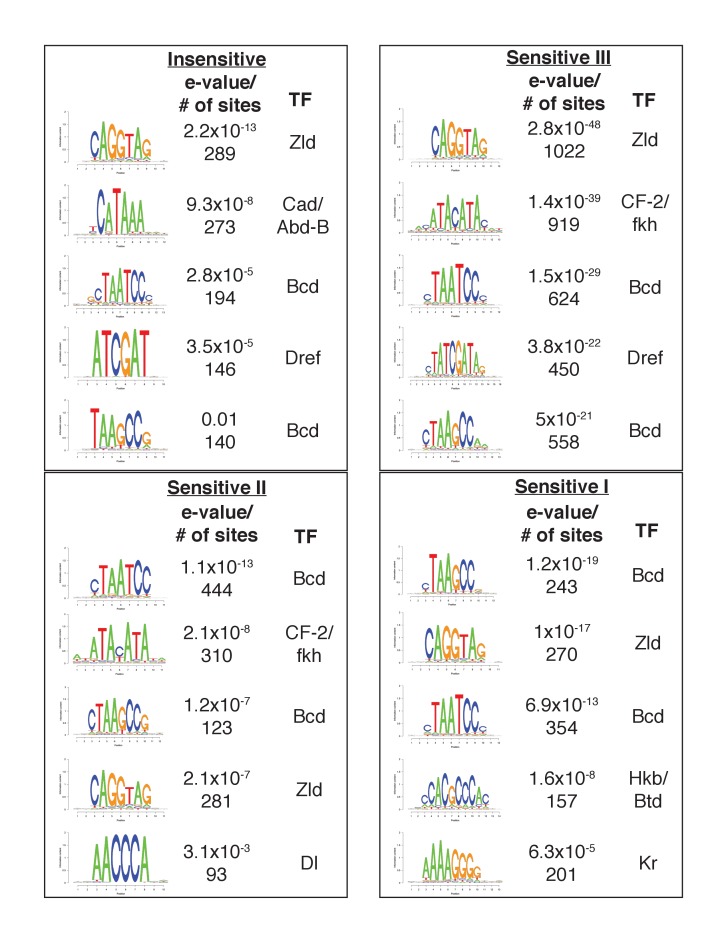
(A) ChIP-seq data in Bcd-bound peaks. Data is displayed as a heatmap of z-score normalized ChIP-seq reads, in a 2 kilobase region centered around each peak. Peaks in each class are arranged in order of decreasing z-scores in wild-type embryos. One peak (peak 549, see Supplementary file 1) was not classified, as it showed increasing binding at decreasing Bcd concentrations. Previously characterized enhancers overlapping with each class are indicated at right. Concentration-Insensitive: the posterior stripe enhancers for both knirps (Pankratz et al., 1992) and giant (Schroeder et al., 2004), and the Krüppel CD1 enhancer (Hoch et al., 1991). Concentration-Sensitive III: cap’n’collar (Schroeder et al., 2004), and huckebein (Häder et al., 2000) enhancers. Concentration-Sensitive II: the hunchback P2 proximal (Struhl et al., 1989) and shadow enhancers (Perry et al., 2011), the even-skipped stripe 2 enhancer (Goto et al., 1989), an early paired enhancer (Ochoa-Espinosa et al., 2005), and an anterior enhancer for giant (Schroeder et al., 2004). Concentration-Sensitive I: buttonhead (Wimmer et al., 1995), orthodenticle (Gao and Finkelstein, 1998), and anterior enhancers for both knirps and giant (Schroeder et al., 2004). (B) Mean expression patterns of Vienna Tile-GAL4 enhancer reporters overlapping with Bcd peaks in each sensitivity class. Peaks and Vienna Tiles with more than one overlap, as well as 11 Vienna Tiles that drove expression at a level too low to quantify, were excluded from the plot. (C) Top DNA motifs discovered by RSAT peak-motifs. The e-value for is a p-value computed from a binomial distribution for a given motif in the dataset, corrected for multiple testing. See Figure 2—figure supplement 1 for de novo motif discovery in each sensitivity class. (D) Heatmap displaying the enrichment of a given motif in each sensitivity class, relative to the peak list as a whole. P-values were generated from permutation tests (n = 10,000 tests).


