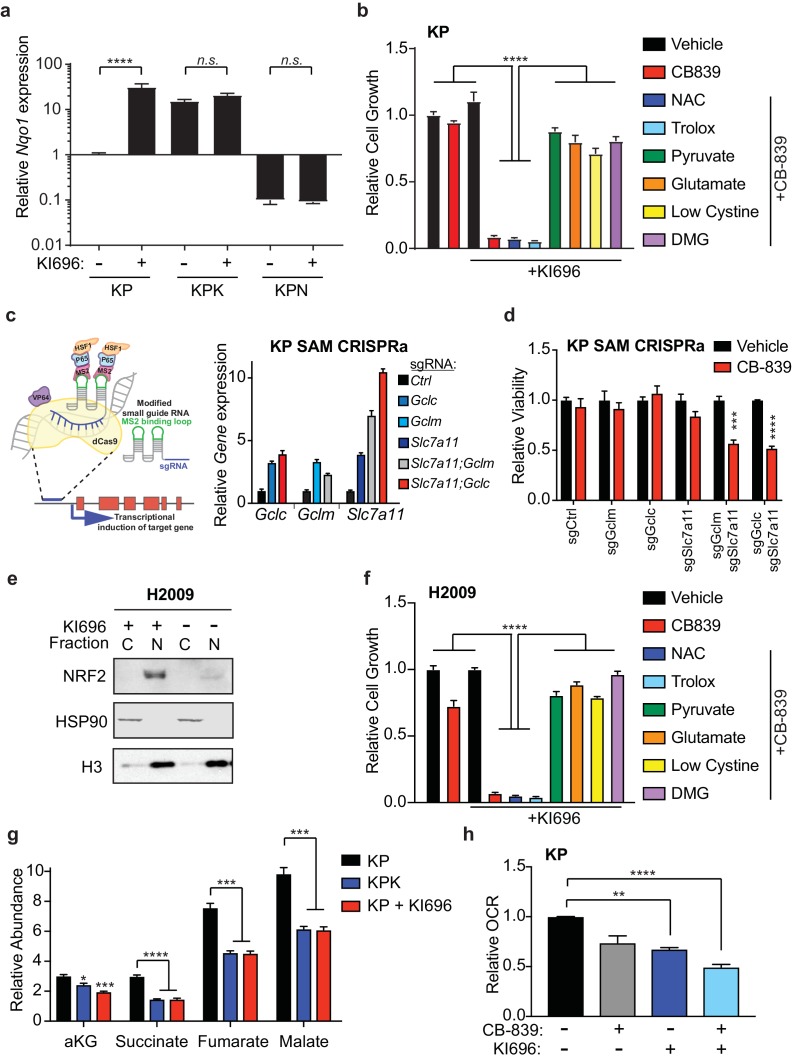
Figure 4. Nrf2 activation is sufficient to sensitize cells to glutaminase inhibition.
(a) Quantitative real-time PCR of mRNA expression of Nqo1 in KP, KPK, and KPN (Nrf2 null) cells after pretreatment with 1 μM KI696 for 36 hr (n = 3, technical replicates). Data presented as relative to Nqo1 expression in untreated KP cells. (b) Proliferation of KP cells after pretreatment with the small molecule activator of Nrf2, 1 μM KI696, followed by treatment with either 500 nM NAC, 500 nM trolox, 2 mM pyruvate, 2 mM DMG, supplementation with 6 mM glutamate, or media containing low cystine (20 μM, 10X reduction from RPMI which contains 208 μM cystine) followed by 250 nM CB-839 treatment for 5 days (n = 5, replicate wells). Data is presented as relative to vehicle treated. (c) Left: Schematic depicting CRISPR synergistic activation mediated (SAM) system. A modified sgRNA recruits catalytically dead Cas9 that is fused to VP64 to promoter regions up stream of the transcription start site of target genes and recruits additional transcriptional activators to induced endogenous transcription of target genes. Right: Quantitative real-time PCR of mRNA expression of Gclc, Gclm, and Slc7a11 in KP SAM CRISPRa cell lines with sgRNAs targeting each gene of interest (n = 3, technical replicates). Data presented as relative to expression of each gene in sgCtrl cells. (d) Proliferation of KP SAM CRISPRa cells expressing sgRNAs against Gclc, Gclm, and Slc7a11. Cells were seeded in media lacking glutamate and after 24 hr were treated with 100 nM of CB-839 for 5 days (n = 3, replicate wells). Data is presented as relative to vehicle treated control for each cell line. (e) Western blot depicting Nrf2 expression in KEAP1 wild type human lung adenocarcinoma line (H2009) after treatment with KI696. Cells were treated with 1 μM KI696 for 36 hr and then nuclear (N) and cytoplasmic (C) fractions were collected. First panel depicts an Nrf2 blot, second panel depicts an Hsp90 loading control for cytoplasmic fraction, and third panel depicts an H3 loading control for nuclear fraction. f) Proliferation of KEAP1 wild type human lung cancer cell line H2009 after pretreatment with the small molecule activator of NRF2, 1 μM KI696, followed by treatment with either 500 nM NAC, 500 nM trolox, 2 mM pyruvate, 2 mM DMG, supplementation with 6 mM glutamate, or media with reduced cystine (20 uM) followed by 250 nM CB-839 treatment for 5 days (n = 5, replicate wells). Data is presented as relative to vehicle treated. (g) Relative abundance of TCA cycle metabolites in KP, KPK, and KP cells treated with 1 μM KI696 (n = 3, triplicate wells). Data is normalized by cell counts for each cell line. (h) Relative mitochondrial respiration measured by oxygen consumption rate (OCR, pmol O2/min) in KP cells treated with either vehicle or 1 μM KI696 followed by treatment with vehicle or 250 nM CB-839 for 4 hr (n = 3, triplicate wells). Data is presented as relative to vehicle treated KP cells. All error bars depict s.e.m. *p<0.05, **p<0.01, ***p<0.001, ****p<0.0001.


