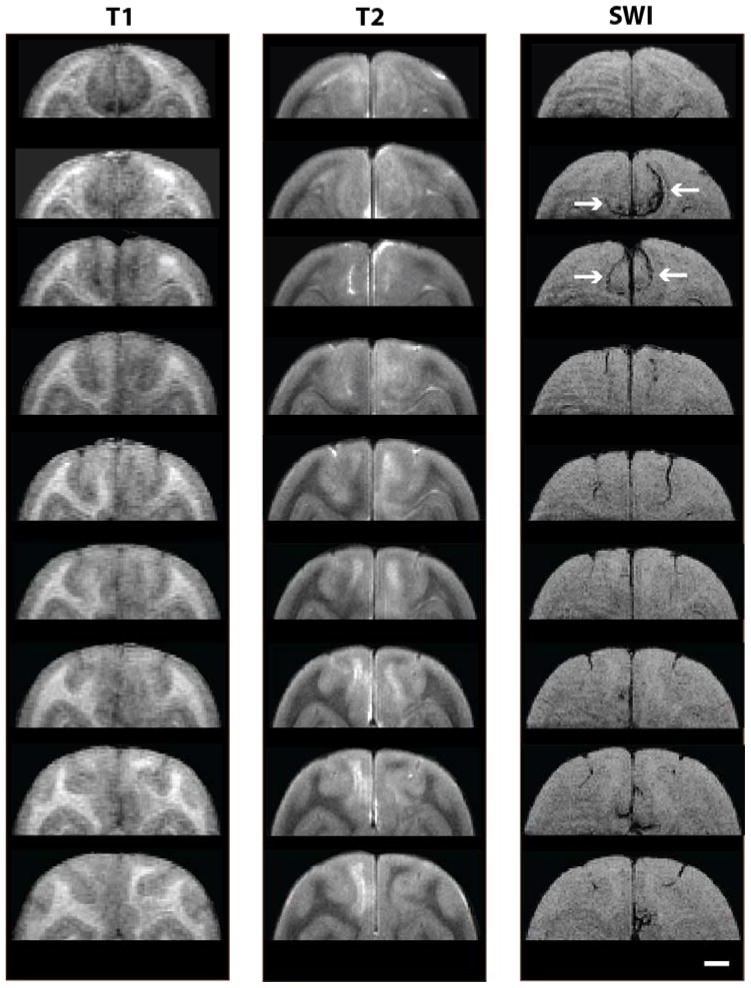
Figure 2. Coronal depiction of ARIA.
T1-, T2-, and SWI-weighted MR images of ARIA-E and ARIA-H are shown at multiple coronal levels of the dorsal parieto-occipital cortex in squirrel monkey 2266 (1mm slice intervals). Both abnormalities extended for several millimeters along the rostro-caudal axis. Signal hypointensities corresponding to ARIA-H are marked by arrows at two coronal levels in the SWI column. Scale bar = 4mm.

