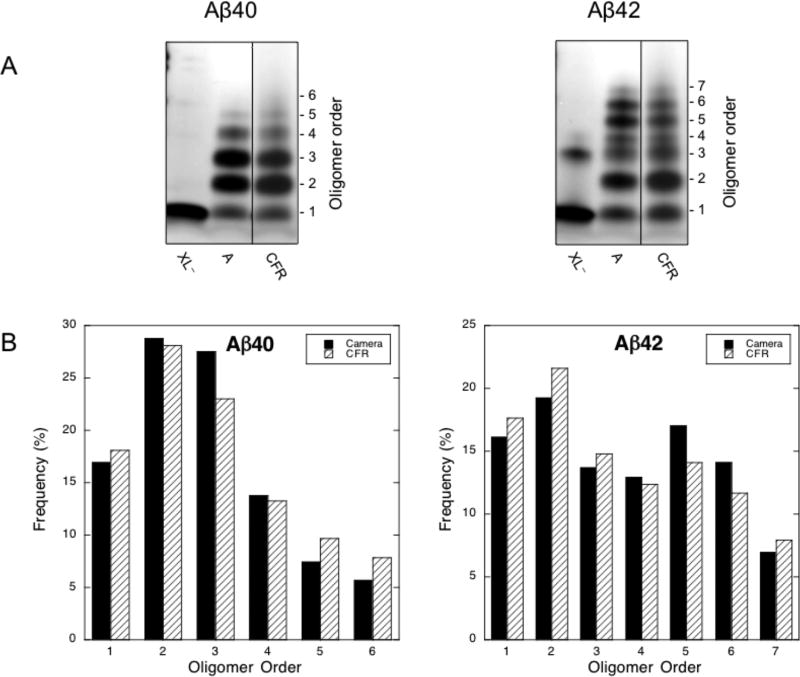
Figure 4.
A) Analytical vs. continuous flow cross-linking of Aβ40 and Aβ42. The leftmost lanes are non-cross-linked protein (XL−), the middle lanes are analytical scale cross-linking (A), and the rightmost lanes are 0.2 ml/min continuous flow cross-linking (CFR), these data from Fig. 3 are shown here side-by-side for clarity of comparison. The number of monomers per oligomer is shown on the right. B) Densitometry analysis of oligomer abundance for analytical vs. continuous flow cross-linking. Oligomer order is plotted vs. oligomer frequency. Black bars show abundance from the analytical scale system. White bars represent the abundance from the continuous flow system.

