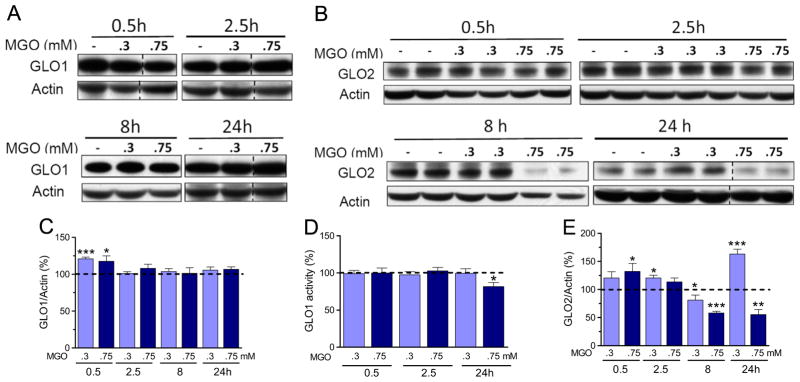
Fig. 4.
GLO1 and GLO2 expression and GLO1 activity in HT22 cells exposed to MGO. (A) GLO1 and (B) GLO2 expression and their respective quantification (C and E); (D) GLO1 activity was determined in HT22 cells exposed to 0.3 or 0.75 mM MGO for the indicated time periods. Densitometric data were normalized to actin content and expressed as a percentage of the untreated control. Vertical dashed lines represent non-adjacent lanes from the same run. Data on graphs are presented as means ± SEM (N=5–9). P<0.05 (*), 0.01(**), or 0.001 (***) indicate significant differences relative to untreated control (horizontally dashed lines).

