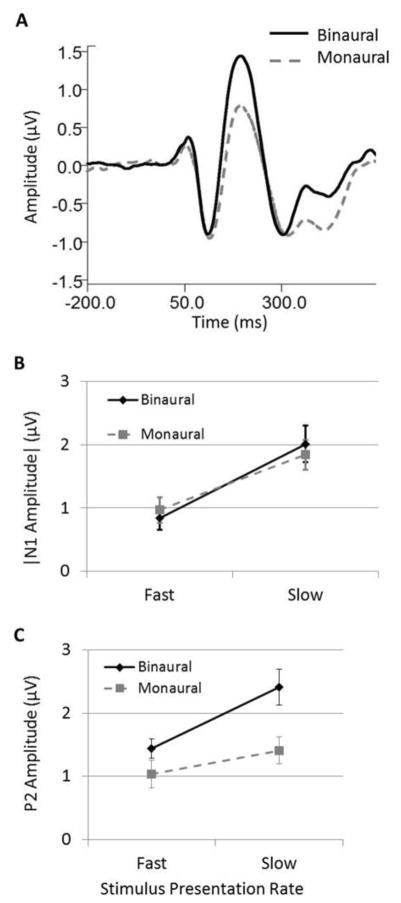
Figure 4.
Ear of presentation effects on CAEPs. Panel A shows grand average Cz waveforms for binaural (solid black) and monaural (dashed gray) presentations collapsed across presentation rate and background noise conditions. Panels B and C depict the average of N1 and P2 peak amplitudes, respectively, in fast and slow rate presentations collapsed across background noise conditions. For the purposes of illustration, N1 amplitudes are displayed as absolute values. Error bars indicate SEM.

