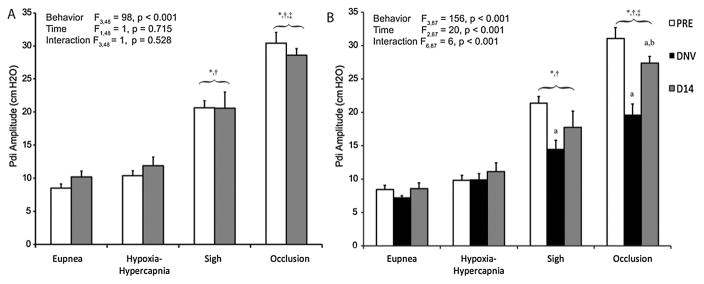
Figure 2.
Pdi amplitude (mean ± SE) during ventilatory and higher force, non-ventilatory behaviors at baseline (PRE, white bars), after unilateral denervation (DNV, black bars), and 14 days after baseline (D14, gray bars) in control (A, n = 8; n=6 for sigh) and denervation groups (B, n = 9; n = 8 for sigh). Main effects from the mixed linear model are presented in the text box and pairwise comparisons denoted by the significance symbols. As expected, Pdi amplitude during sigh and occlusion is higher than for hypoxia-hypercapnia and eupnea in both groups at all time-points. There were no differences over time in the control group (see 3.1). In the denervation group, Pdi amplitude during sigh and airway occlusion was significantly reduced immediately after unilateral denervation, but only during airway occlusion by 14 days afterwards. *, different from eupnea for the same time-point (p < 0.05); †, different from hypoxia-hypercapnia for the same time-point (p < 0. 05); ‡, different from sigh for the same time-point; a, different from PRE for the same motor behavior (p < 0.05); b, different from DNV for the same motor behavior (p < 0.05).

