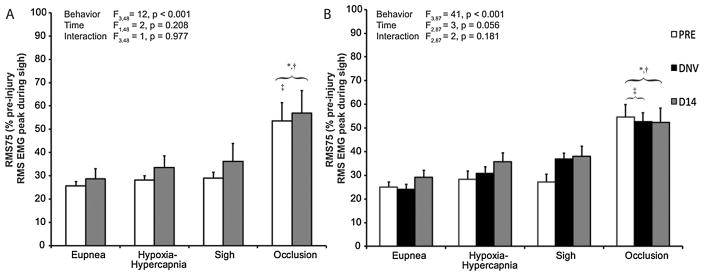
Figure 4.
Neural drive to phrenic motoneurons (central respiratory drive) estimated by the RMS EMG value at 75 ms after onset (normalized to peak RMS EMG during sigh at baseline; RMS75). RMS75 is shown across motor behaviors at baseline (PRE, white bars), after unilateral denervation (DNV, black bars), and 14 days after baseline (D14, gray bars) in control (A, n = 8; n=6 for sigh) and denervation groups (B, n = 9; n = 8 for sigh). Main effects from the mixed linear model are presented in the text box and pairwise comparisons denoted by the significance symbols. As expected, RMS75 during occlusion was significantly greater than RMS75 during eupnea, hypoxia-hypercapnia, and sigh. There was no statistically significant effect on RMS75 as a result of chronic denervation (see 3.3). *, different from eupnea for the same time-point (p < 0.05); †, different from hypoxia-hypercapnia for the same time-point (p < 0.05); ‡, different from sigh for the same time-point (p < 0.05).

