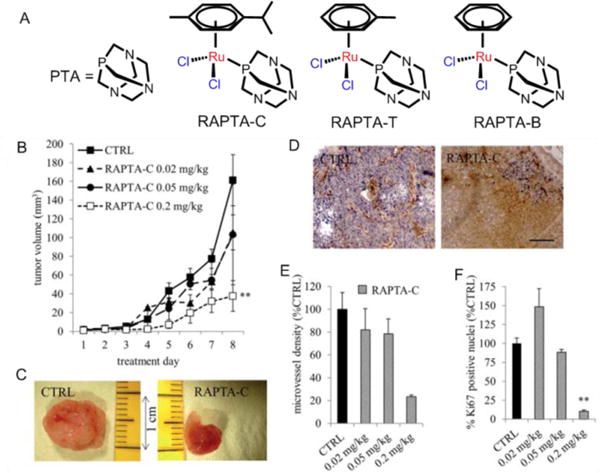
Fig. 15.

(A) The structures of PTA, RAPTA-C, RAPTA-T and RAPTA-B. (B) Growth curve of A2780 tumors with respect to RAPTA-C treatment. (C) Images show representative tumors from the vehicle treated (CTRL) and RAPTA-C (0.2 mg kg-1) treated CAMs. (D) Representative images of the immunohistochemical staining of the endothelial cell marker CD31 (in brown) showing reduced microvessel density per mm2 in tumors treated with RAPTA-C normalized to the tumor surface area and provided as a % of the control (E) and Ki-67 positive nuclei (in blue) (D) and quantification of the percentage of the tumor surface area staining positive for Ki-67 (as a % of CTRL) (F). Black bar in the right image of (D) represents 500 mm and is valid for both images. Reproduced with permission from ref. 168. Copyright 2012, Royal Society of Chemistry.
