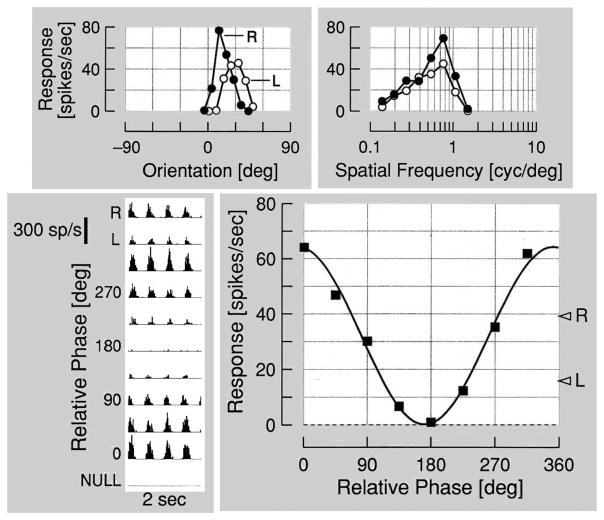
Figure 10.
A typical phase specific response pattern is shown for a simple cell in the visual cortex. Responses in the top row represent monocular tuning functions for orientation and spatial frequency. At the bottom left post stimulus time histograms are shown for relative intraocular phase positions combined with interleaved monocular responses. On the lower right, harmonic analysis shows a sinusoidal pattern of alterations in neural response as a function of relative intraocular phase.

