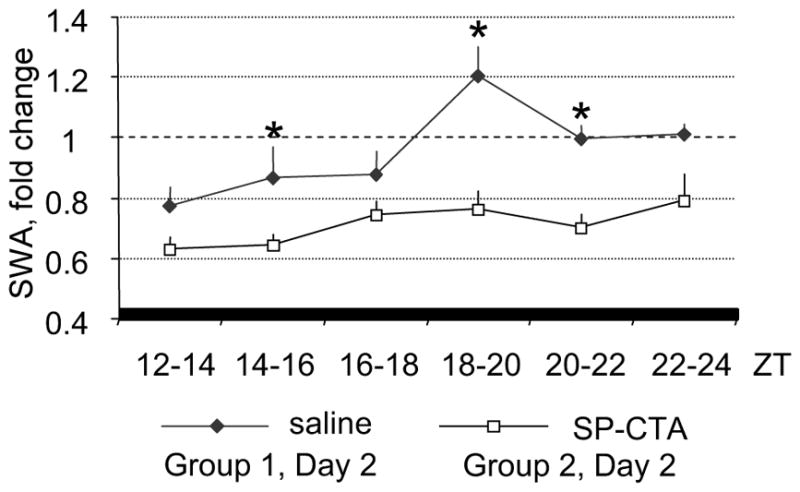
Figure 5.

Profile of changes of NREM sleep SWA in SP-CTA and saline-treated mice. SWA was calculated as change from the average value of SWA recorded during the corresponding 12-h baseline period. *P < 0.05 between groups.

Profile of changes of NREM sleep SWA in SP-CTA and saline-treated mice. SWA was calculated as change from the average value of SWA recorded during the corresponding 12-h baseline period. *P < 0.05 between groups.