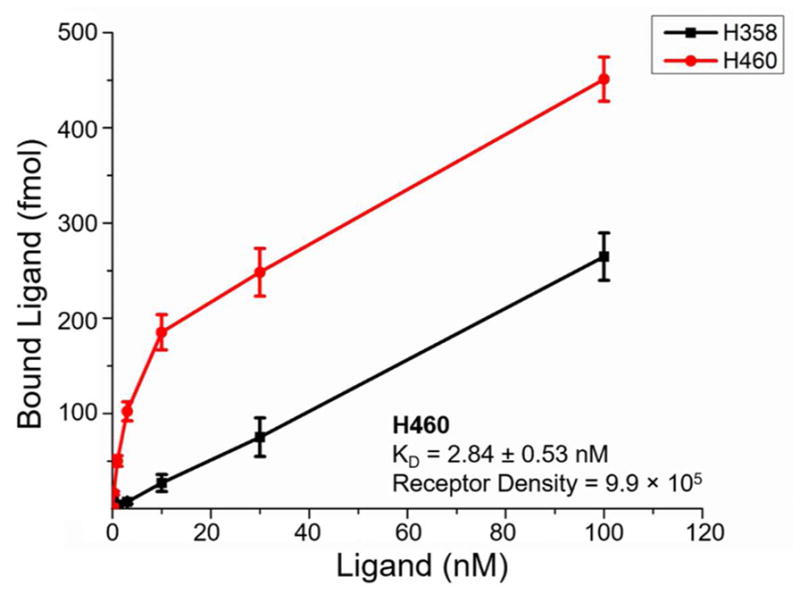
Figure 2.

CD146 saturation binding curve in lung cancer cell lines with total binding plotted as y-axis. The KD and receptor density values were calculated as 2.84 ± 0.53 nM and 9.9 × 10⁵ receptors per cell in the H460 cell line, respectively. The receptor density and KD values corresponding to H358 cells could not be determined reliably.
