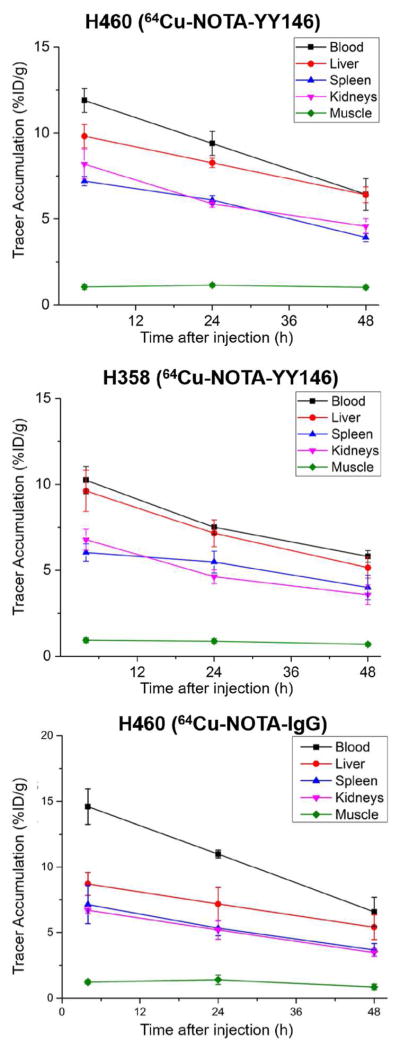
Figure 5.
PET image-derived time-activity curves showing the biodistribution of the tracers (64Cu-NOTA-YY146 and 64Cu-NOTA-IgG) in H460 and H358 tumor-bearing mice. The TACs revealed that the clearance behavior of the tracer from the blood pool was similar between both models. The other organs (liver, spleen, kidney, muscle) showed similar trends. Results were expressed as %ID/g (mean ± SD).

